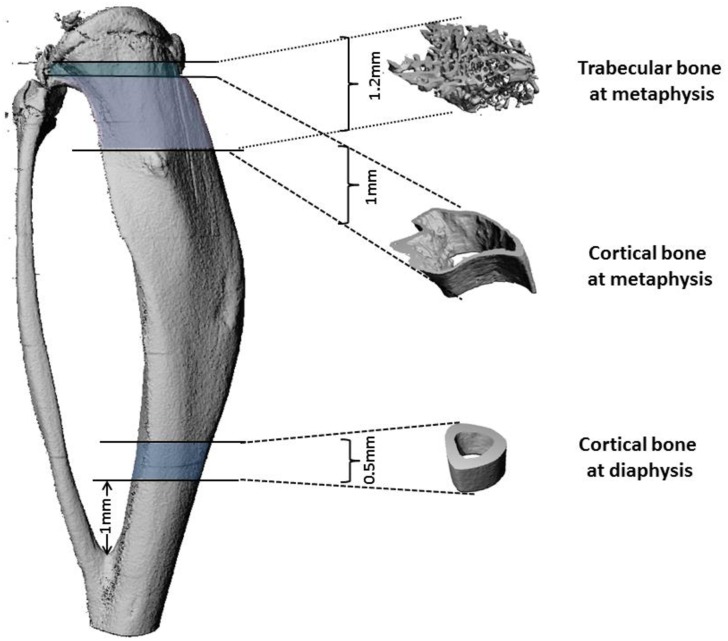
Fig 2. Trabecular and cortical bone regions analyzed by microCT.
Trabecular bone microarchitecture was analyzed below the growth plate. 1.2mm was analyzed, which represents 63 slices in vivo (19 μm) and 120 slices ex vivo (10 μm voxel size). Cortical bone microarchitecture was analyzed below the growth plate (1mm analyzed representing 53 slices in vivo and 100 slices ex vivo) and above the tibia-fibula junction (0.5mm analyzed representing 26 sections in vivo and 50 sections -ex vivo).

