
Fig 1. Schematic illustration of the construction of the partialDE models and Mcell stochastic simulations for cAMP compartmentation and diffusion.
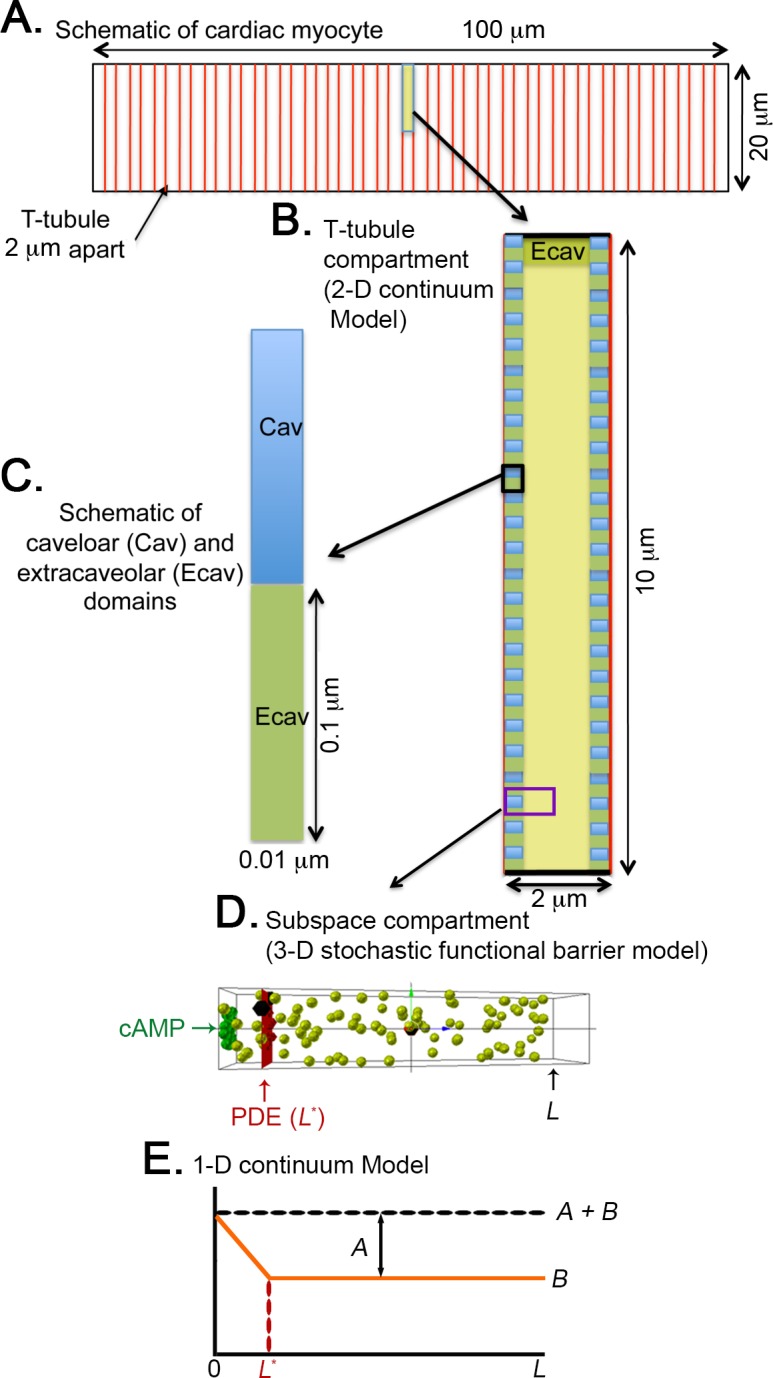
(A) The longitudinal cross-section of an adult ventricular myocyte, which is 100 μm x 20 μm. (B) The repeating pattern of the intracellular space between adjacent t-tubules, which are 2 μm apart. Each unit is half the width of the cell (10 μm). The 2-D continuum model is at this level. (C) The sarcolemmal membrane lining the t-tubules contains caveolar domains 51 where βARs and AC5/6 are localized. Caveolar domains (blue) are 100 nm x 10 nm, spaced 100 nm apart. In this example, extracaveolar domains (green) are associated with the subsarcolemmal space of the t-tubules (between caveolar domains) as well as the peripheral sarcolemma. (D) A single caveolar domain and half of each adjacent extracaveolar flanking region. All of the PDE modelcules are located at a distance (L*) from the plasma membrane (the site of cAMP production). L indicates the most distal site from the plasma membrane in the compartment. The Mcell simulations were carried out in a subspace compartment (from L* to L) on this microdomain. (E) A schematic of the steady state distribution of cAMP along the microdomain in D as derived using the 1-dimensional continuum model. The concentration is A+B at the cAMP production site (z = 0). Beyond the PDE barrier (from L* to L), the concentration of cAMP is B.