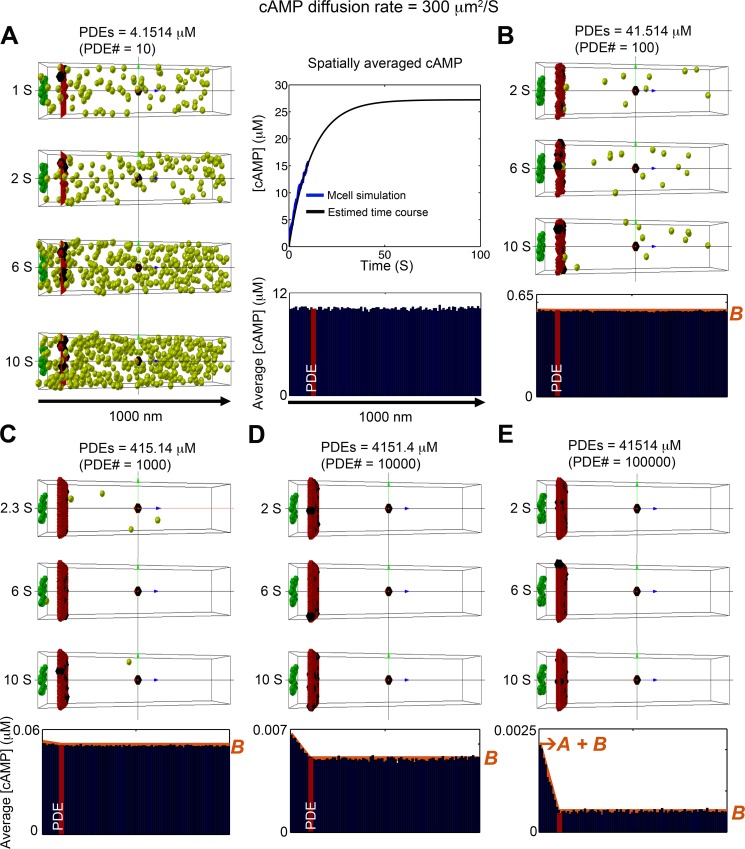
Fig 3. Stochastic simulation of cAMP diffusion implemented in MCell and visualized using CellBlender.
Snapshots in time of cAMP distribution generated by a single caveolar domain (green box) containing 15 β1ARs, surrounded by non-caveolar space (200 x 200 x 1000 nm), which produced cAMP 120 molecules/s. Freely diffusing cAMP molecules are shown in light green. PDE molecules were placed on a plane at z = 100 nm from the caveloar domain as functional barriers (red plane). (A) 10 PDE molecules (~4.1514 μM). Four time snapshots are shown on the left panels, average concentration of cAMP over 1800 time frames from 1s to 10s are shown in the blue bar graph in the bottom right panel. The top right panel shows the time course of the spatially averaged cAMP concentration over the full domain; simulated data are shown as blue line, and black line depicts an exponential curve that show the approach to steady state. (B-E) The effects of vaying PDE concentration. Three time snapshots are shown in the top panels, and average concentration of cAMP molecules for 1800 time frames from 1s to 10s at steady state are shown in the blue bar graph in the bottom right panels. (B) PDE molecules = 100 (~41.514 μM). (C) PDE molecules = 1000 (~415.14 μM). (D) PDE molecules = 10000 (~4151.4 μM). (E) PDE molecules = 100000 (~41514 μM). The red curves plotted on the accumulated concentration maps in panel (B-E) show the predictions of the 1D continuum model. In all cases, there is excellent agreement with the full 3D stochastic model. The cAMP compartmentation ratio R (see text) for the various values of PDE concentration shown in panels (A-E) are 6.098 x 10⁻⁵, 3.040 x 10⁻³, 3.188 x 10⁻², 2.491 x 10⁻¹, and 7.685 x 10⁻¹.

