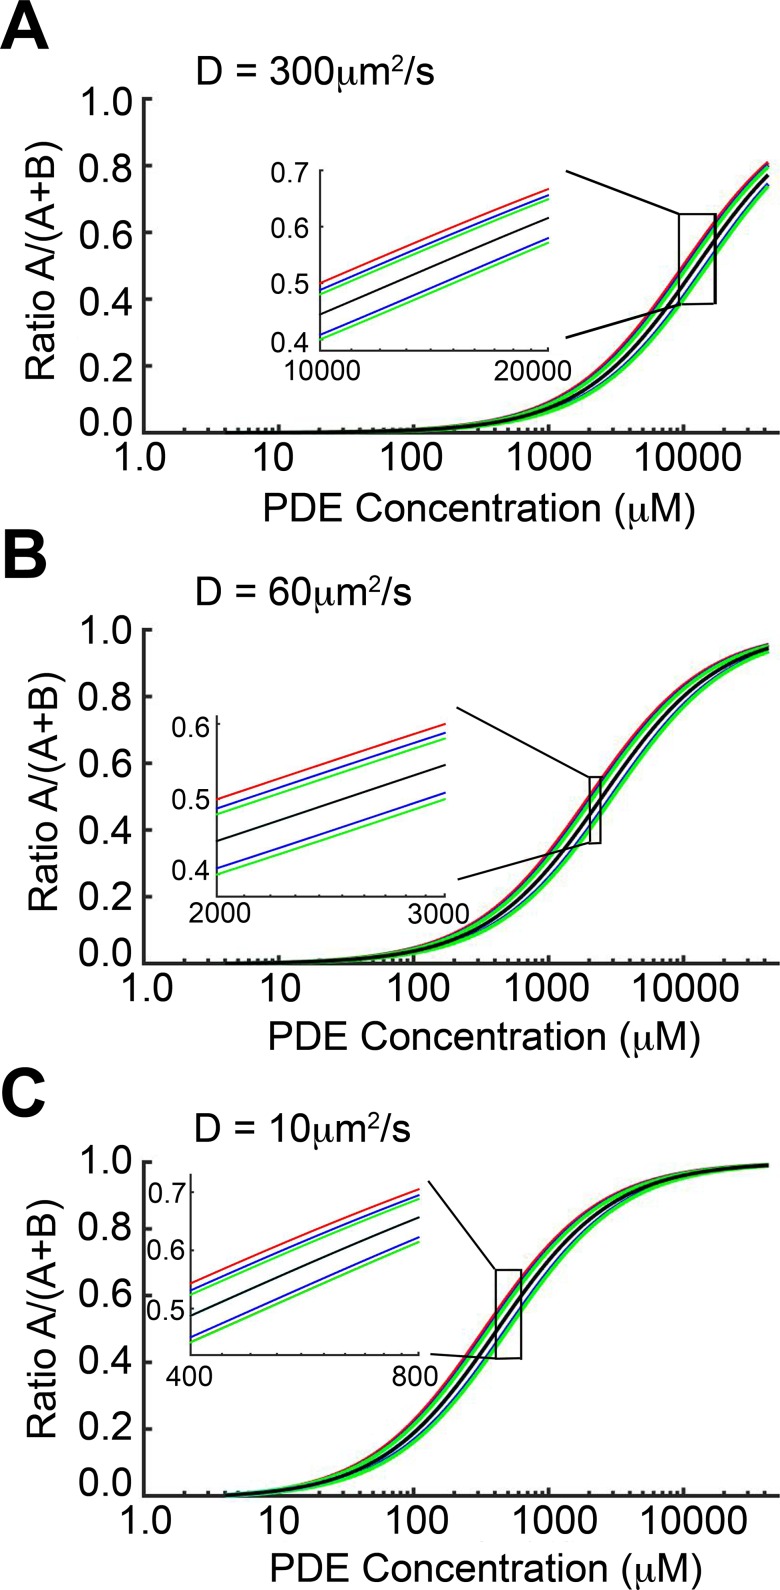
Fig 5. Sensitivity analysis using 1-dimensional continuum model.
cAMP compartmentation ratio R as a function of PDE concentration for diffusion constants of (A) 300, (B) 60, and (C) 10 μm2/s, respectively. Black lines correspond to default parameter values used in Figs 3, 4, and 5. Pairs of colored lines show R when the parameters D/(L*kf) (red), kb (blue), kcat (green), and JB (cyan) were adjusted by ±20%. Note that, in all cases, the lower red line is obscured by a green line and both cyan lines are almost entirely obscured by the black line. For PDE concentrations between 1 and 100 μM, R was insensitive to perturbations to parameters (in terms of change of the absolute magnitude of the ratio).

