Figure 3.

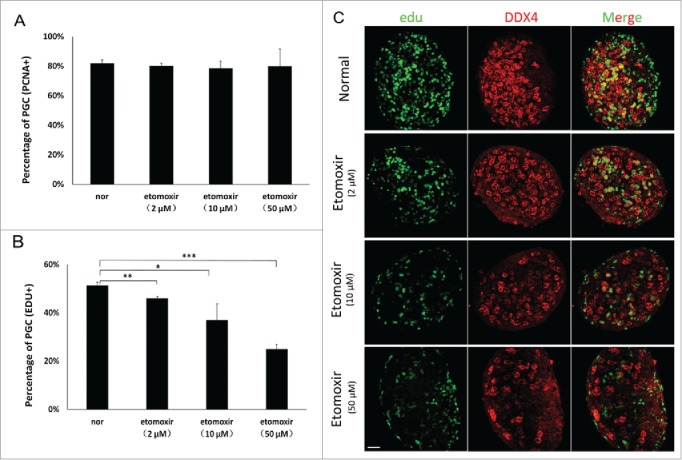
Reduced number of PGCs resulted from the proliferation defect. (A) Percentage of PCNA-positive PGCs in treated groups was similar to controls. Percentages in control and treated groups were 82±2 .3%, 80±1 .8%, 79±4 .3% and 80±11 .7%, respectively. (B) Edu was incorporated into PGCs. Edu-positive cells were counted in 3 sections from the middle part of individual genital ridges. The percentage of Edu-positive PGCs progressively decreased. (C) PGCs incorporating Edu were quantified using immunofluorescence staining; number of Edu-positive cells were determined in 3 independent experiments. Bar=50 μm.
