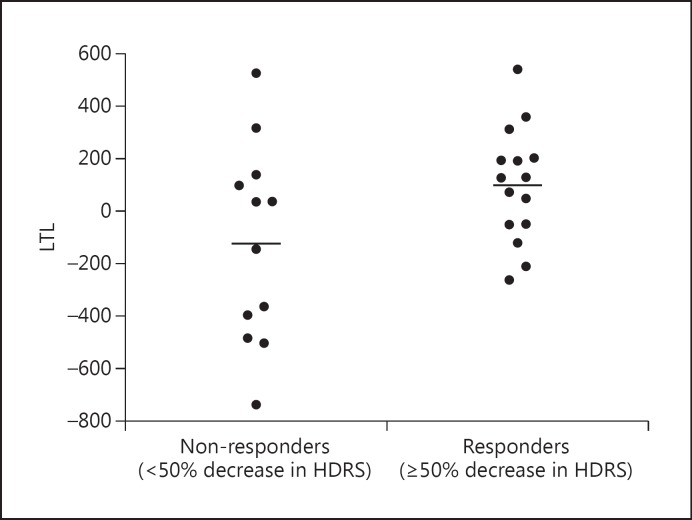
Fig. 1.
Pre-treatment LTL in subjects classified as responders (≥50% decrease in HDRS ratings over the 8 weeks of treatment) and non-responders (<50% decrease in HDRS ratings over the 8 weeks of treatment) [F(1, 21) = 4.985, p = 0.037, 95% CI −640.44 to −22.74, d = 0.947]. Data represent residual values after adjusting for age, sex, BMI, and LTL assay batch; therefore, LTL data may be positive or negative.

