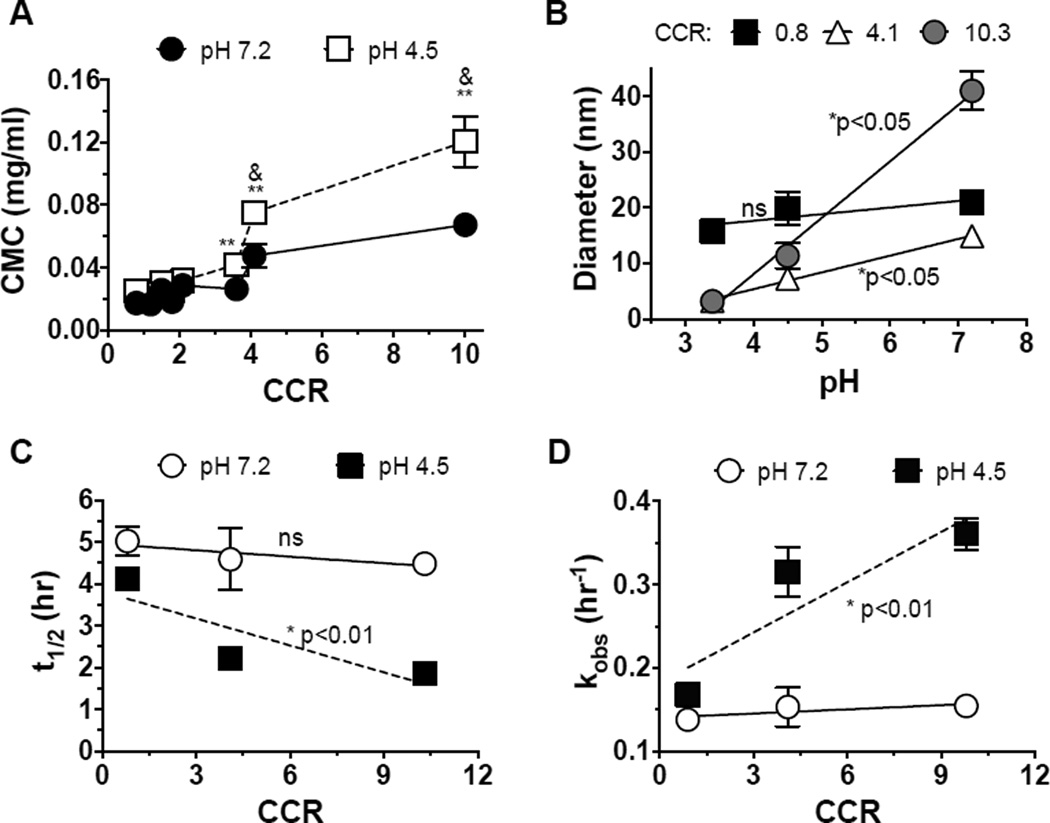
Figure 1. Impact of CCR on NPC pH-responsiveness and farnesol release.
A. Change in critical micelle concentration (CMC) at acidic pH as a function of pH. ** denote a significant difference when comparing pH 4.5 and pH 7.2 (p<0.001). & denotes a significant difference when comparing different CCR (p<0.01). The error bars represent standard deviation (n=3). B. NPC diameters as a function of pH. NPC with larger CCR (smaller cores) exhibit smaller diameters at acidic pH. C–D. Farnesol release half-life and release constants of nanoparticles with different CCR. Raw release data is shown in Supplementary Figure 1. * denotes a significant difference of the slope versus 0. ns = no significant difference. Note that A–B is NPC alone while C–D is farnesol-loaded NPC.

