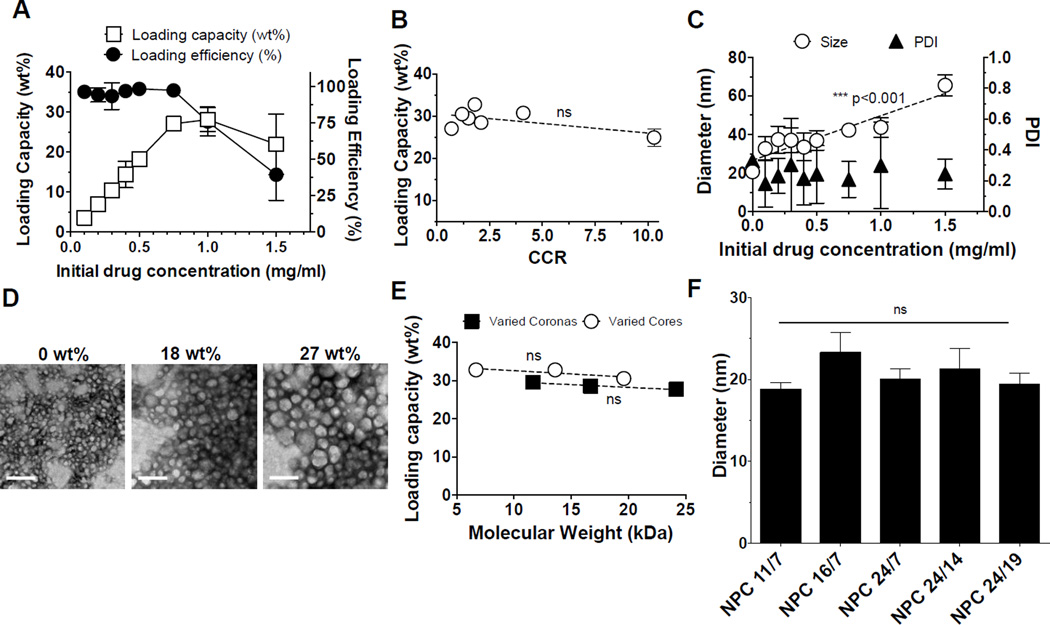
Figure 2. Characterization of farnesol-loaded NPC.
A. NPC9/13 loading capacity (le6 axis) and loading efficiency (right axis) was examined as a function of farnesol concentration. B. Loading capacities of micelles as a function of CCR. C. NPC9/13 diameters increase (circles) upon loading farnesol, and NPC PDI (triangles) were <0.3 upon loading with farnesol. D. Morphological characteristics of NPC loaded with farnesol by transmission electron micrographs (scale bar = 100 nm). 18 and 27 wt% of farnesol was loaded into NPC, respectively. E. Maximal drug loading capacity was measured as a function of corona and core molecular weights. Maximal drug loading capacity was independent of corona and core sizes within the tested NPC range. F. Increased diameters of micelles tested in Figure 2E a6er loading farnesol at maximum loading capacities compared to micelles alone. *** denote a significant difference of a trend from 0 as determined by two-tailed T-test (C). ns = no significant difference (B). Error bars represent standard deviation (n=4).

