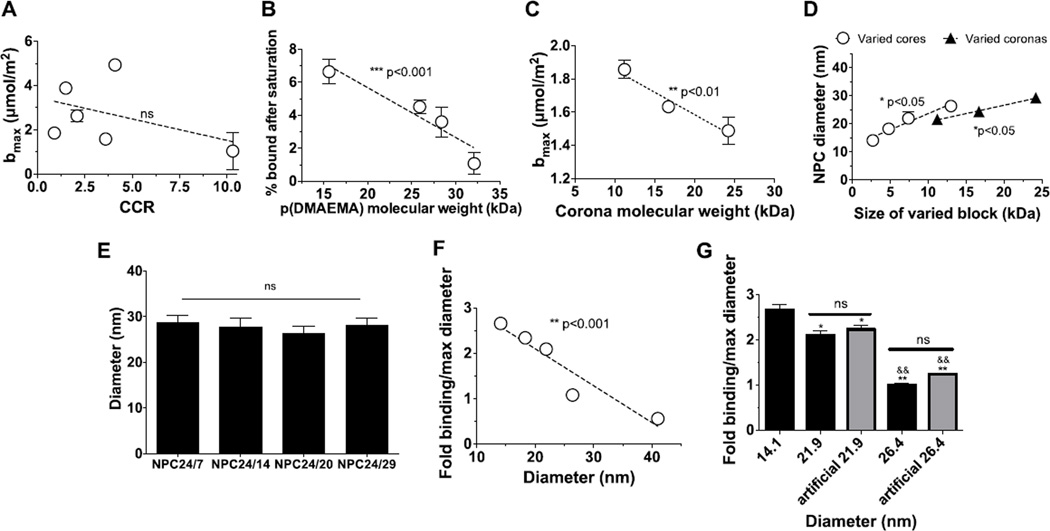
Figure 3. Electrostatic binding of micelles to HA surfaces.
A. Maximal binding capacities of micelles as a function of CCR. B. Decreases in p(DMAEMA) binding as a function of molecular weight. C. Confirmation of enhanced binding of NPC with small p(DMAEMA) molecular weights with uniform diameters. D. Increases in diameters as a function of corona and core sizes. E. Similar sizes were observed with micelles with greater overall molecular weights. F. Increases in HA binding observed as a function of diameter. G. Confirmation of enhanced binding of NPC with small diameters. Fold binding relative to micelles with maximum diameters (26.4 nm). ***p<0.001, **p<0.01 and *p<0.05 denote a significant difference of a trend from 0 as determined by two-tailed T-test (A, B, C, and D). ns = no significant difference. Specifically in G, * denotes a significant difference among 14.1 nm group and rest of the groups. (*p<0.05, **p<0.01); & denotes a significant different among 21.9 nm group and the rest of the groups (&&p<0.01). The error bars represent standard deviation (n=3).

