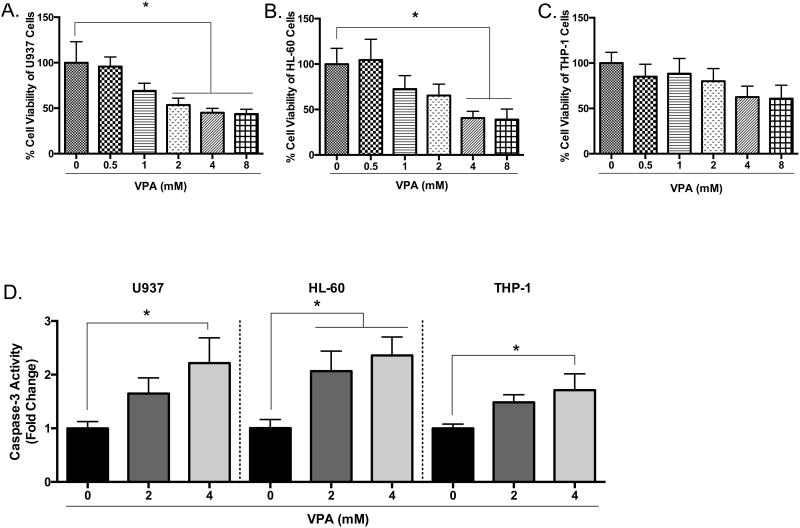
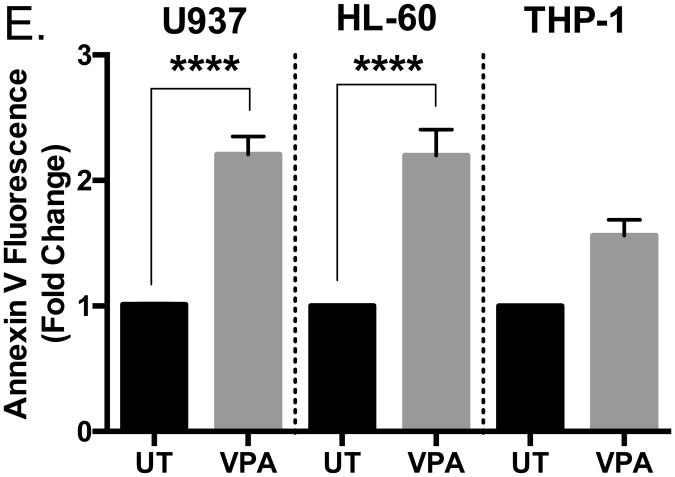
Figure 3. Valproic acid-induced apoptosis in leukemia cells.
Cells were treated with various concentrations of valproic acid (VPA) for 24 hours. (A) U937, (B) HL-60, and (C) THP-1 cell viability were determined using trypan blue exclusion assay. n = 5. (D) U937, HL-60, and THP-1 cells were untreated or treated with 2 or 4 mM of VPA for 24 hours and subjected to colorimetric caspase-3 assay. n = 7, 5, and 7 respectively. (E) Cells were treated with valproic acid (4 mM) and Annexin V fluorescence was measured by flow cytometry. n = 7. *p < 0.05, ****p < 0.0001 when compared to the untreated (0).


