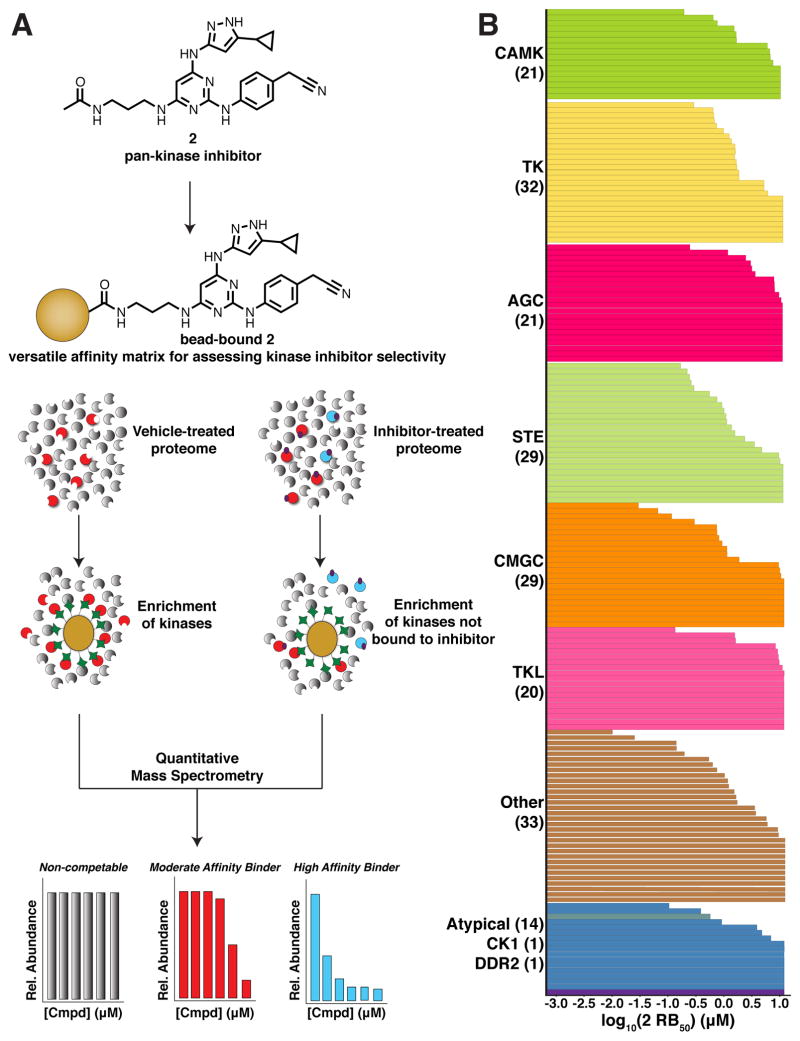
Figure 3.
A single component affinity matrix based on pan-kinase inhibitor 2. (A) Schematic of quantitative chemical proteomics workflow. Lysates are pre-treated with free 2 or DMSO before enrichment with 3-conjugated resin. Quantitative mass spectrometry is then employed to determine the affinity of cellular protein kinases for 2. (B) The average half-maximal residual binding (RB50) values of 182 protein kinases from K562 lysate for inhibitor 2 that were determined in two independent quantitative chemical proteomics experiments. Each bar in the graph represents an individual kinase RB50 value and the number of kinases in each group is shown in parentheses below the group name. RB50 values are listed in SI, Table S1.

