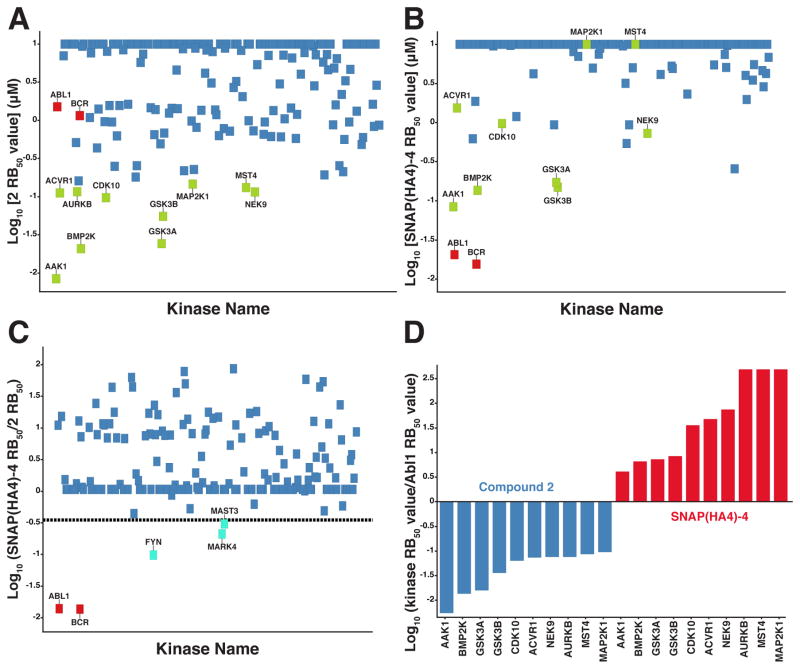
Figure 5.
Quantitative competition-based chemical proteomics. (A) Log10[RB50 values] (average of 2 independent experiments) of 182 kinases for unconjugated inhibitor 2. Each kinase is represented as a square. BCR and Abl are shown as red squares. Kinases with RB50 values ≤150 nM are labeled (green squares). Kinases with RB50 values >150 nM are unlabeled and shown in blue. (B) Log10[RB50 values] (average of 2 independent experiments) of 206 kinases for SNAP(HA4)-4. The color coding scheme for each kinase was retained from panel A. (C) Log10[Relative RB50 values] (average of 2 independent experiments) of kinases for SNAP(HA4)-4 compared to 2. The dotted line represents ≥3-fold increase in potency for the assembled bivalent inhibitor. Kinases with ≥3-fold increase in potency for the assembled bivalent inhibitor compared to 2 are labeled (cyan squares). All other kinases are unlabeled and shown in blue. (D) Bar graphs showing selectivity ratios (log10[RB50 for kinase listed/RB50 for BCR-Abl]) for 2 and SNAP(HA4)-4.

