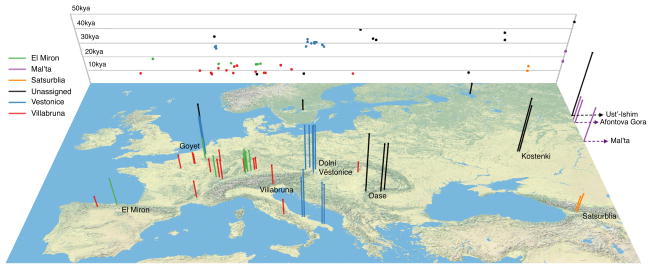
Figure 1. Location and age of 51 ancient samples.
Each bar corresponds to a sample, the color code designates the genetically defined sample cluster, and the height is proportional to sample age (the background grid shows a projection of longitude against sample age). To help in visualization, we add jitter for sites with multiple samples from nearby locations. Four samples that are from Siberia are plotted at the far eastern edge of the map.

