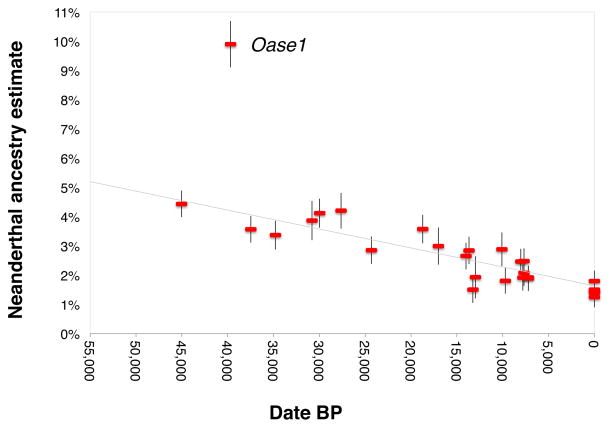
Figure 2. Decrease of Neanderthal ancestry over time.
Plot of radiocarbon date against Neanderthal ancestry for samples with at least >200,000 SNPs covered, along with present-day Eurasians (standard errors are from a Block Jackknife). The least squares fit (gray) excludes the data from Oase1 (an outlier with recent Neanderthal ancestry) and three present-day European populations (known to have less Neanderthal ancestry than East Asians). The slope is significantly negative for all eleven subsets of samples we analyzed (10−29<P<10−11 based on a Block Jackknife) (Extended Data Table 3).

