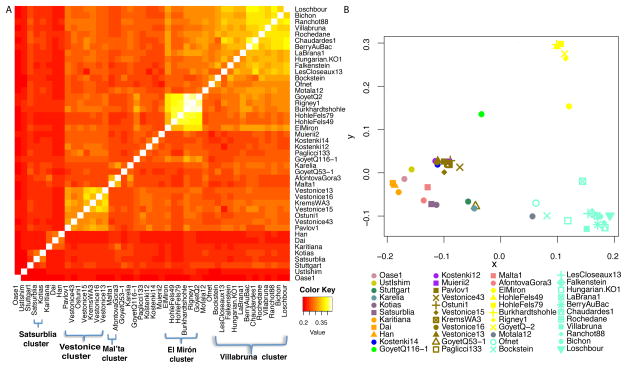
Figure 3. Genetic clustering.
(A) Shared genetic drift measured by f3(X,Y; Mbuti) among samples with at least 30,000 SNPs covered (for AfontovaGora3, ElMiron, Falkenstein, GoyetQ-2, GoyetQ53-1, HohleFels49, HohleFels79, LesCloseaux13, Ofnet, Ranchot88 and Rigney1, we use all sequences for higher resolution). Lighter colors indicate more shared drift. (B) Multidimensional Dimensional Scaling (MDS) analysis, computed using the R software cmdscale package, highlights the main genetic groupings analyzed in this study: Vestonice Cluster (brown), Mal’ta Cluster (pink), El Mirón Cluster (yellow), Villabruna Cluster (light blue), and Satsurblia Cluster (dark purple). The affinity of GoyetQ116-1 (green) to the El Mirón Cluster is evident in both views of the data.

