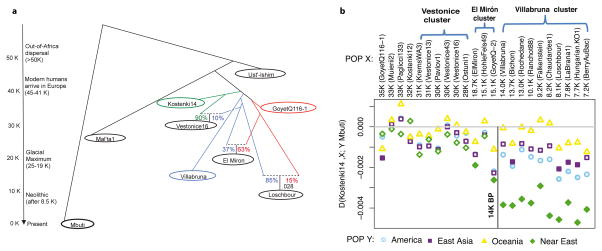
Figure 4. Population history inferences.
(A) Admixture Graph relating selected high coverage samples. Dashed lines show inferred admixture events; the estimated mixture proportions fitted using the ADMIXTUREGRAPH software are labeled28 (the estimated genetic drift on each branch is given in a version of this graph shown in Supplementary Information section 6). The samples are positioned vertically based on their radiocarbon date, but we caution that the population split times are not accurately known. We use color to highlight important early branches of the European founder population: the Kostenki14 lineage is modeled as the predominant contributor to the Vestonice Cluster (green); the GoyetQ116-1 lineage as the predominant contributor to the El Mirón Cluster (red); and the Villabruna lineage as broadly represented across many clusters. (B) Drawing together of European and Near Eastern populations ~14,000 years ago. Plot of affinity of each pre-Neolithic European population X to non-Africans outside Europe Y moving forward in time, comparing to Kostenki14 as a baseline; values Z<-3 standard errors below zero are indicated with filled symbols (we restricted to individuals with >50,000 SNPs). We observe an affinity to Near Easterners beginning with the Villabruna Cluster, and another to East Asians that affects a subset of the Villabruna Cluster.

