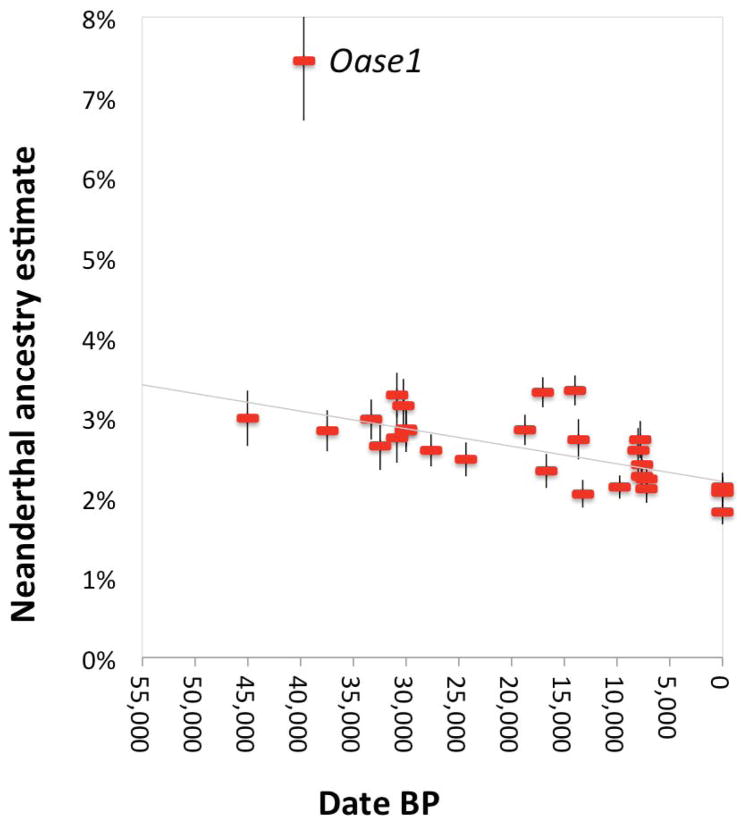
Extended Data Figure 1. A decrease in Neanderthal ancestry in the last 45,000 years.
This is similar to Figure 2, except we use ancestry estimates from rates of alleles matching to Neanderthal rather than f4-ratios, as described in Supplementary Information section 3). The least squares fit excludes Oase1 (as an outlier with recent Neanderthal ancestry) and Europeans (known to have reduce Neanderthal ancestry). The regression slope is significantly negative (P=0.00004, Extended Data Table 3).

