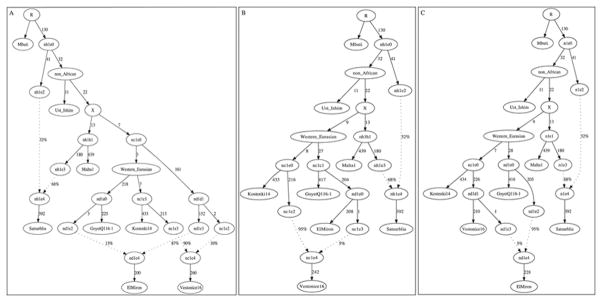
Extended Data Figure 4. An Admixture Graph model that fits the data for Satsurblia, an Upper Paleolithic sample from the Caucasus.
This model uses 127,057 SNPs covered in all populations. Estimated genetic drifts are give along the solid lines in units of f2-distance (parts per thousand), and estimated mixture proportions are given along the dotted lines. All three models provide an fit to the allele frequency correlation data among Mbuti, UstIshim, Kostenki14, Vestonice16, Malta1, ElMiron and Satsurblia to within the limits of our resolution, in the sense that all empirical f2-, f3- and f4-statistics relating the samples are within three standard errors of the expectation of the model. Models in which Satsurblia is modeled as unadmixed cannot be fit.

