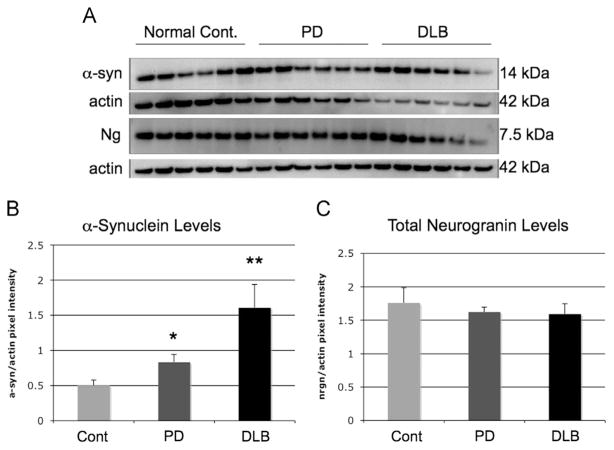
Fig. 3.
Neurogranin and α-synuclein Western blot in superior temporal cortex in human brains. α-Syn protein levels as analyzed by Western blot and compared to actin were increased between PD and DLB brains when compared to normal controls (Fig. 4A and B) (*=<.05; **=<.01). Neurogranin levels remained the same between normal controls, PD and DLB brains (Fig. 4A and C).

