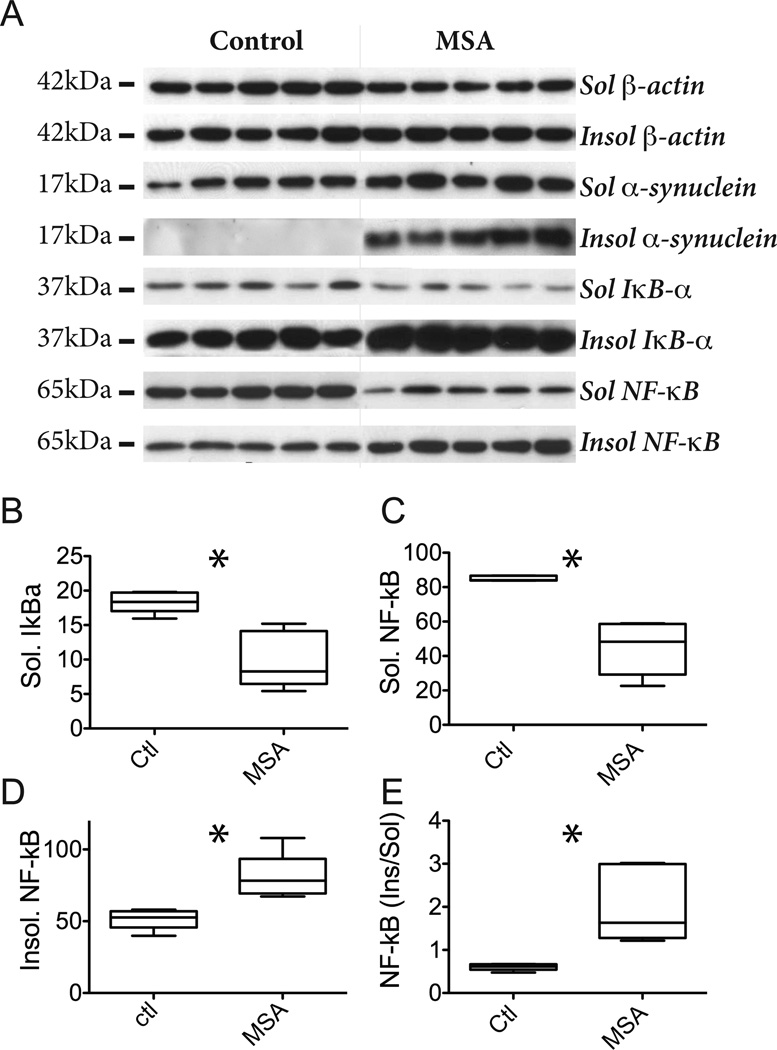
Figure 5. NF-κB and IκBα are increased in MSA white matter.
A, Brain tissue (precentral gyrus white matter) from 5 control and 5 MSA patients was fractionated in soluble and insoluble proteins. Insoluble proteins were subsequently solubilized in SDS prior to electrophoretic analysis. Proteins (20 µg) were resolved by SDS-PAGE and analyzed by immunoblotting using antibodies against α-syn, IκBα, and NF-κB p65. β-Actin was included as loading control. The molecular sizes (kDa) of the presented bands are indicated to the left. B–E., The intensities of the individual bands in soluble and insoluble fractions (from A) were quantified and band intensities were normalized to β-actin. Box plots indicate mean, min, max and S.D. values of the five cases and asterisk indicates significant difference between boxes when analyzed by unpaired t test (two tailed p < 0.05). B, Relative amounts of soluble IκBα in control and MSA cases. The 0.54 fold decrease is significant (p = 0.003). C, Relative amounts of soluble NF-κB in control and MSA cases. The 0.53 fold decrease is significant (p = 0.0004). D, Relative amounts of insoluble NF-κB in control and MSA cases. The 1.55 fold increase is significant (p = 0.006)..E, Ratio of insoluble and soluble NF-κB in control and MSA cases. The 3.4 fold increase is significant (p = 0.007).

