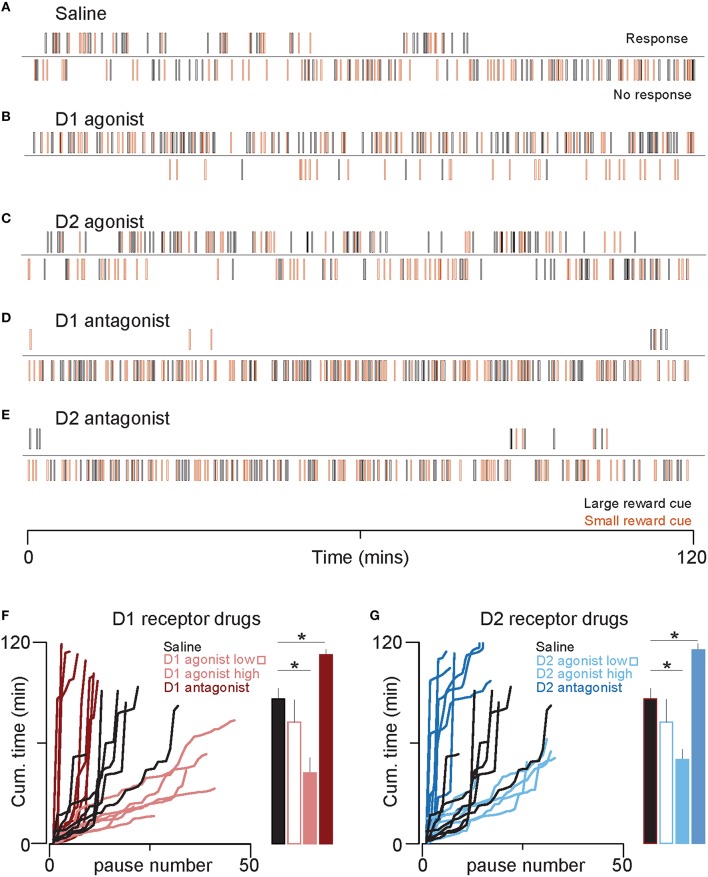
Figure 2.
D1 and D2 receptor agonists decrease time spent in the non-responsive state. (A–E) Rasters show five example sessions, one for each drug (high doses only). Each line represents the time at which a cue predicting large (black) or small reward (orange) was presented. The top raster of each pair indicates cues that the animal responded to by entering the receptacle. The bottom raster indicates cues that the animal did not respond to. Note that the length of the non-responsive state is longer toward the end of the session in the control condition (A), but the non-responsive state is very short or absent in the D1 agonist (B) and D2 agonist (C). (F) The left graph plots cumulative time spent in the non-responsive state against the number of transitions from responsive to non-responsive. Thus, steeper lines indicate long pauses (non-responses to contiguous sequences of cues) interrupted with few responses and shallower lines represent short pauses with frequent responses. Each line is the data from an individual rat. The bar plots on the right show the mean cumulative time spent in a non-responsive state over the entire session for each treatment group. Color conventions are identical to those in Figure 1D. (G) The graphs follow identical conventions to those in (F), but here for the D2 agonist and antagonist treatments. Color conventions are the same as those in Figure 1E. *p < 0.05.

