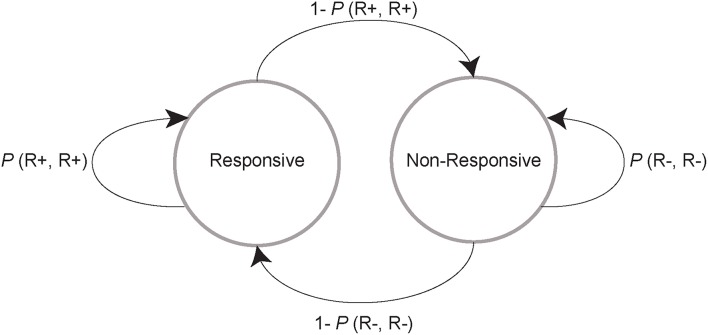
Figure 3.
Schematic of a two-state Markov model. On a given trial, a rat can either stay in the responsive (left circle and looping arrow) or non-responsive state (right circle and looping arrow) or transition to the other state (arrows between the circles). Each of these events occurs with a probability that is calculated by classifying all trials as those in which the animal responded (R+) and did not respond (R−), and then classifying the next trial in the same way. This procedure results in 4 possible categories for any consecutive pair of trials: R+,R+; R+,R−; R−,R−; and R−,R+. The probability of the second trial outcome given the first is determined with the equation P(Response type 1, Response type 2) = N(Response type 1, Response type 2) / N(Response type 1), where N is the number of trials. The 4 categories that describe the possible behaviors in any pair of trials form a stochastic matrix. We resolved this matrix into steady state probability vectors, which yield an estimate of the probability of finding each subject in either the responsive or non-responsive state at a steady state of the Markov chain.

