Figure 4.
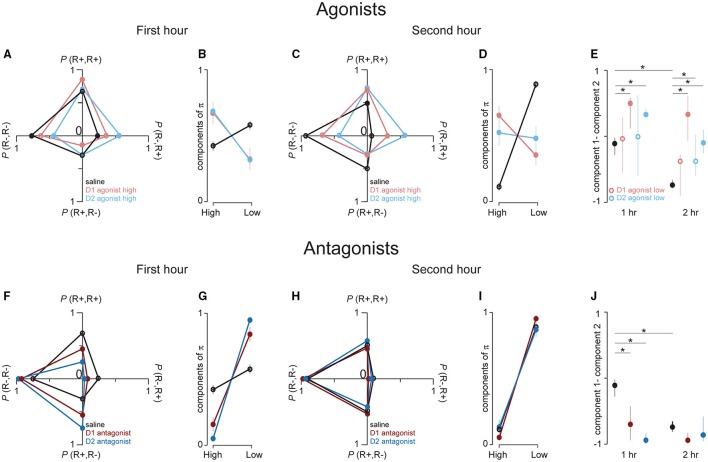
D1 and D2 receptor agonists promote transistions from the non-responsive to responsive state. (A,C,F,H). These graphs show the associated transition probabilities for all 4 possible response/no response pairs, calculated with the equation given in the legend to Figure 3. (A) The dots represent the transition probabilities in the first hour of behavioral testing for saline (black), high dose D1 agonist (red) and high dose D2 agonist (blue) treated rats. Note that in this first hour there is a very high probability of responding to a cue if the rat responded to the previous cue; this is indicative of response clustering. (B) The dots represent the cross-session mean of the components of the probability vectors calculated from the transition matrices that compose the mean probabilities in (A). The two components give a steady state estimate of the probability of the rats being in the high (“High,” left dots) and low (“Low” right dots) responsive state, respectively. D1 agonist data is almost completely obscured by the D2 agonist data. (C,D) This data comes from the same sessions as in (A,B), but the data is taken from the second hour of testing. (E) Dot plots show the median and middle quartiles of the differences between the two components of the probability vectors that are shown in (B) (left set of dot plots) and (D) (right dot plots). Filled symbols represent saline and high agonist doses. Open symbols represent low agonist doses (corresponding data in (A–D) are not shown for low doses). (F–J) Same plotting conventions as in (A–E), but these figures show data from the first (F,G) and second hour (H,I) after saline (black), D1 antagonist (dark red) and D2 antagonist (dark blue) injections. *p < 0.05.

