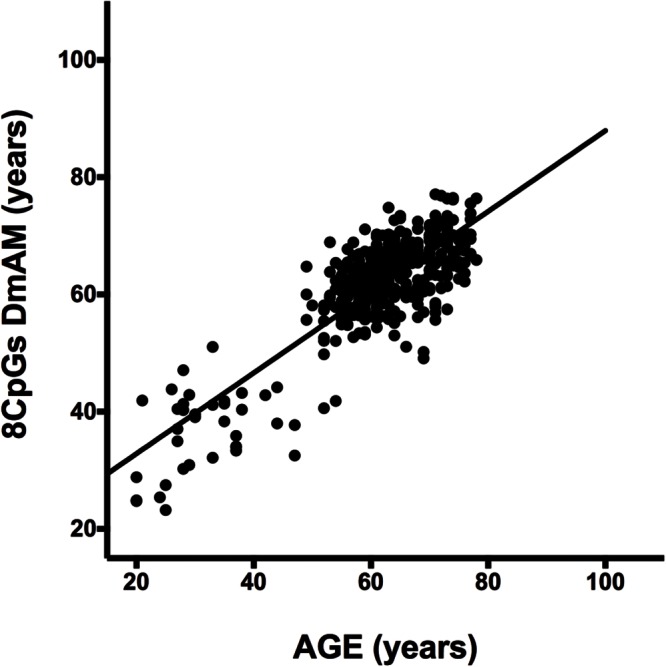
FIGURE 1.

Results of the 8 CpG DNA methylation age measures (DmAM) in the training set. The scatterplot represents age in the horizontal axis, against the 8 CpG DmAM in the vertical axis from the healthy donors of the training set (n = 390). Straight lines represent least squares regression fit to the data.
