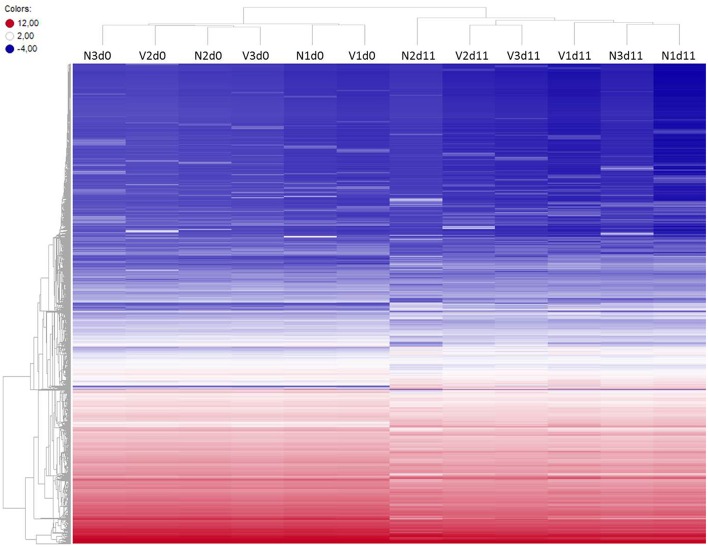
Figure 1.
Heatmap of global expression levels of mRNA and lincRNA in the liver of non-vaccinated (N) and vaccinated (V) mice on day 0 p.i. (Nd0, Vd0) and day 11 p.i. (Nd11, Vd11). Expression levels for each sample were hierarchically clustered. Log2 transformed expression levels range from −4 to 12 indicated by blue and red color, respectively.

