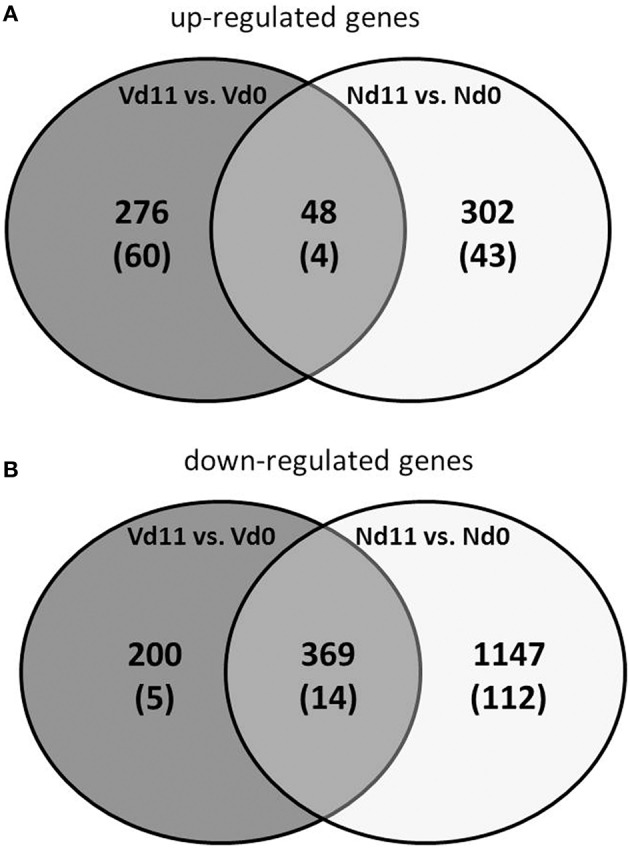
Figure 2.

Venn-diagram of the number of up-regulated (A) and down-regulated (B) genes expressed more than 3-fold (p < 0.01) in the liver of vaccinated mice infected with P. chabaudi toward the end of the crisis phase on day 11 p.i. (Vd11) in comparison to constitutive expressions day 0 p.i. (Vd0). Nd11 vs. Nd0 indicates number of those genes identified in the liver of non-vaccinated mice. Numbers in brackets indicate genes more than 10-fold changed.
