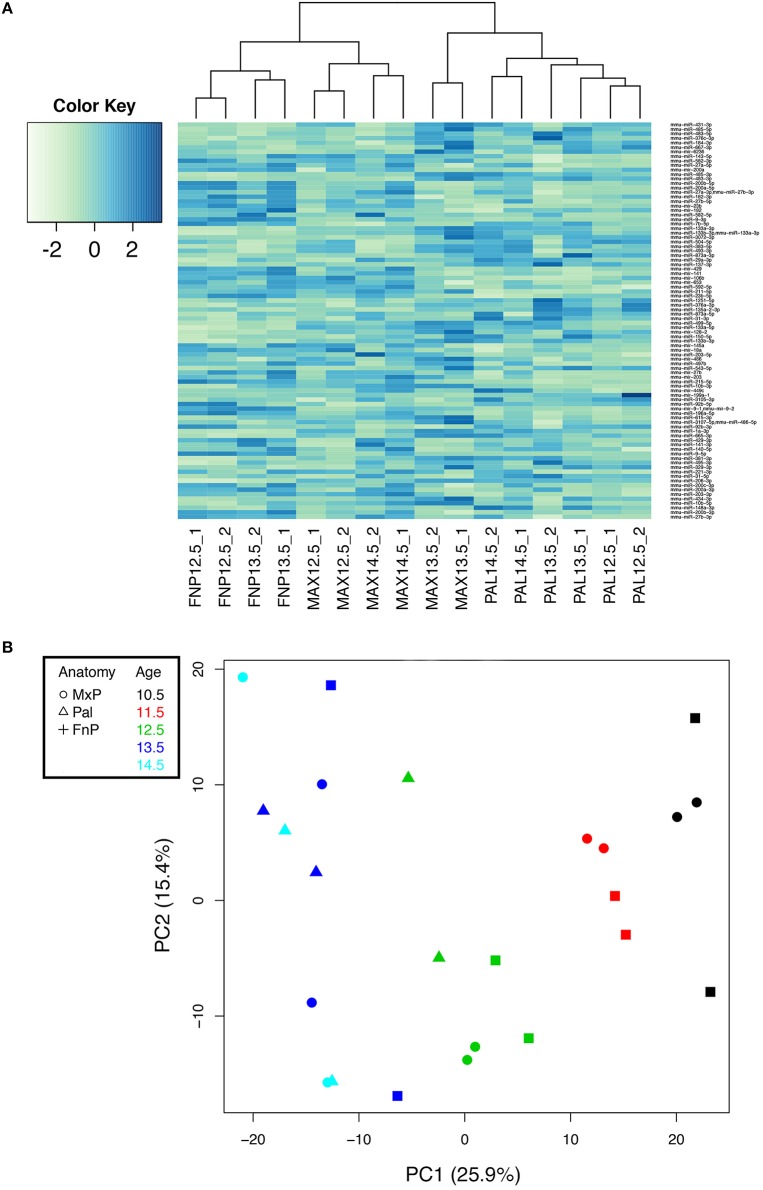
Figure 1.
Analysis of miRNA-Seq data defines miRNAs whose expression differs by prominence. (A) 49 mature miRNAs and 11 hairpin miRNAs were differentially expressed by prominence (FDR adjusted p < 0.01). Hierarchical clustering of their normalized and scaled expression values (using the R hclust function, ward. D2 method) shows groups of miRNAs enriched in the frontonasal prominence (FnP), palate (Pal), the maxillary prominence (Max), or in combinations thereof. The dendrogram at the top shows the clustering of the samples; the three major divisions correspond to FnP, Pal, and Max, and duplicate samples cluster together. (B) Principal Component Analysis (PCA) analysis of data. Data is color coded by age (inset), with tissue source denoted by symbol (inset). Principal Component 1 (PC1) distributes samples by age. Principal Component 2 (PC2) is orthogonal to PC1 but does not correspond to any obvious property of the samples.

