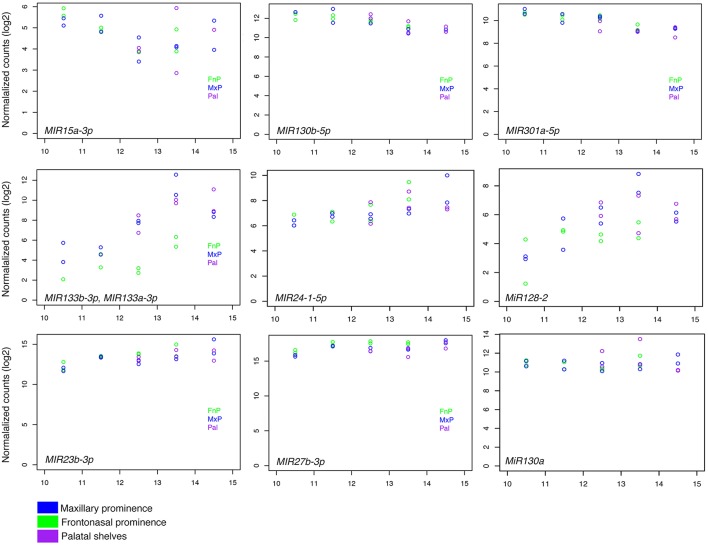
Figure 2.
RNAseq values for expression of selected miRNAs. Normalized counts for selected miRNAs from each prominence (see inset) as compared to embryonic age (E10–15). Each row represents a different pattern of expression over time. (Top) Mir15a, Mir130b, and Mir301a showed a downward trend of expression over time. (Middle) Expression of Mir133b, Mir24.1, and Mir1282 increased over time. (Bottom) Mir23b, Mir27b, and Mir130a were expressed consistently over time. Blue, Maxillary prominence; Green, Frontonasal prominence; and Purple, Palate.

