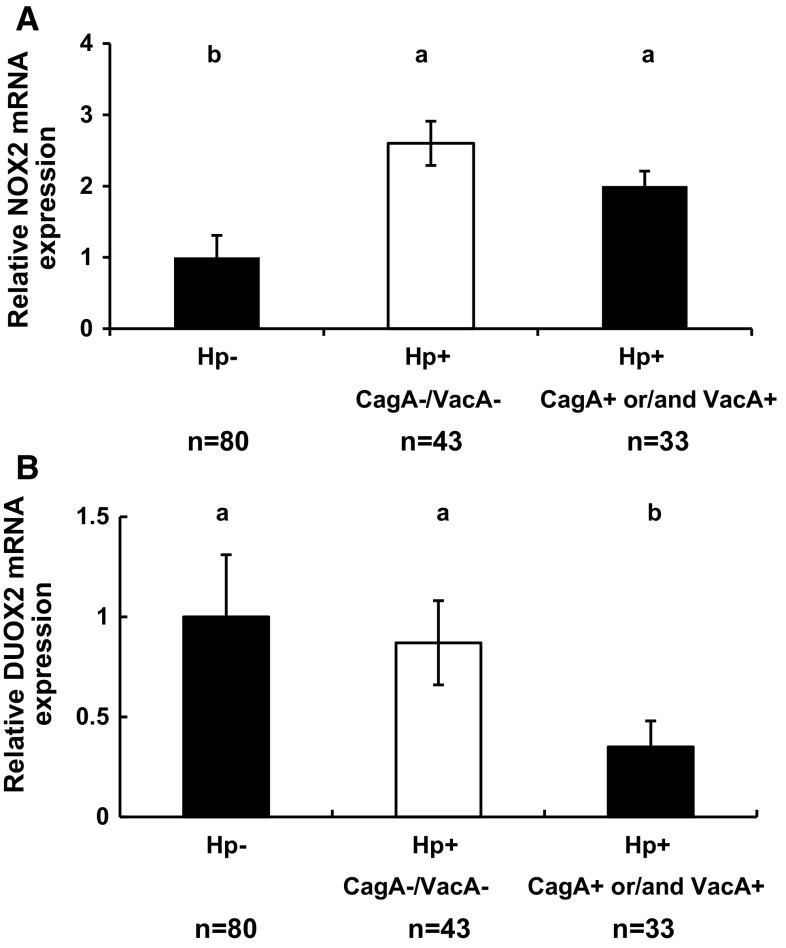
Fig. 2.
Comparison of NOX2 and DUOX2 mRNA levels in the gastric mucosa of Hp− and Hp+ patients. a Comparison of NOX2 mRNA levels between Hp− patients, Hp+ CagA−VacA−, and patients infected with Hp+ secreted one of CagA and VacA or both. b Comparison of DUOX2 mRNA levels in the same groups as NOX2. The message levels are normalized with beta-actin mRNA levels. The error bars are SEM. Different letters above the columns indicate that the means are different, where a > b (P < 0.05)

