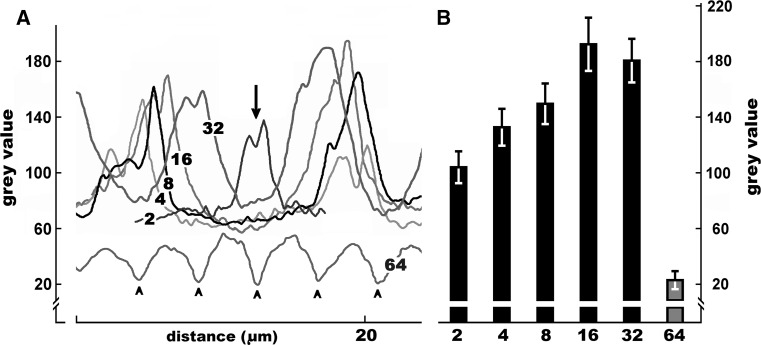
Fig. 3.
Changes in the intensity of PIN2-LPs immunofluorescence (expressed as grey value) evaluated for successive developmental stages of antheridial filaments. a Representative single axial scans across transverse cell wall areas in selected 2-, 4-, 8-, 16-, 32-, and 64-celled antheridial filaments (developmental stage indicated by the inserted number). For the two-celled antheridial filament a single cell wall region was scanned (middle plot; arrow), for each of the 4–32 cell stages two cell wall regions were scanned, and for the 64-celled stage (early spermiogenesis) five cell wall regions were scanned (arrowheads). b Mean intensity (±SD) of PIN2-LPs immunofluorescence evaluated for cell wall regions in antheridial filaments during successive stages of the proliferative period (2–32 cell stages; black bars in the diagram) and during early spermiogenesis (64 cell stage; grey bar in the diagram). The data were statistically evaluated using one-way ANOVA (F (5,354) = 1130.54, p < 0.001) and then with Bonferroni post hoc test. The Bonferroni test has shown statistical significance for all analyzed data sets at the p < 0.001 level

