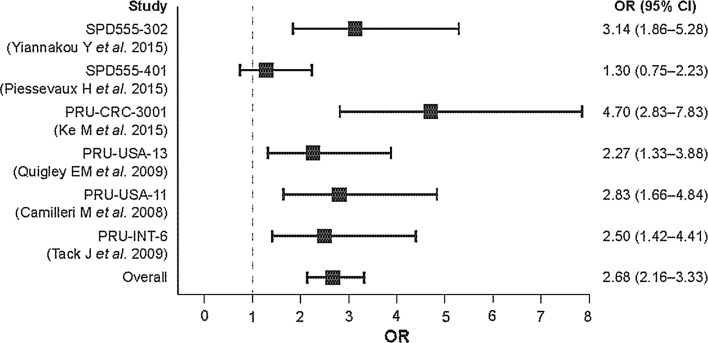
Fig. 5.
Forest plot comparing prucalopride with placebo for a frequency of ≥3 spontaneous complete bowel movements per week for each of the phase 3 and 4 clinical trials and for the integrated (pooled) patient population. Breslow–Day test for inconsistency of response rates between studies resulted in a p value of 0.0406 and an I 2 statistic of 56 %, indicating a moderate heterogeneity. CI confidence interval, OR odds ratio

