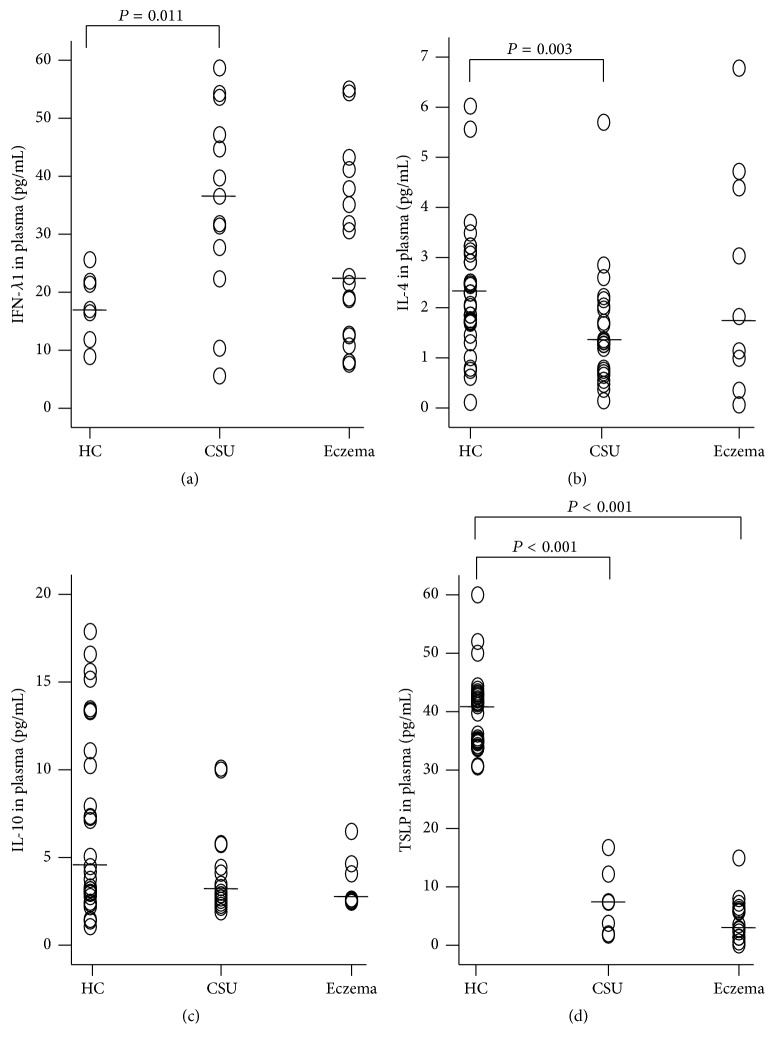
Figure 1.
Scatter plots of the levels of interferon- (IFN-) λ1 (a), IL-4 (b), IL-10 (c), and thymic stromal lymphopoietin (TSLP) (d) in the plasma of the patients with urticaria and healthy control subjects (HC). Each symbol represents the value from one subject. The median value is indicated with a horizontal line. P < 0.05 was taken as statistically significant. See Table 2.

