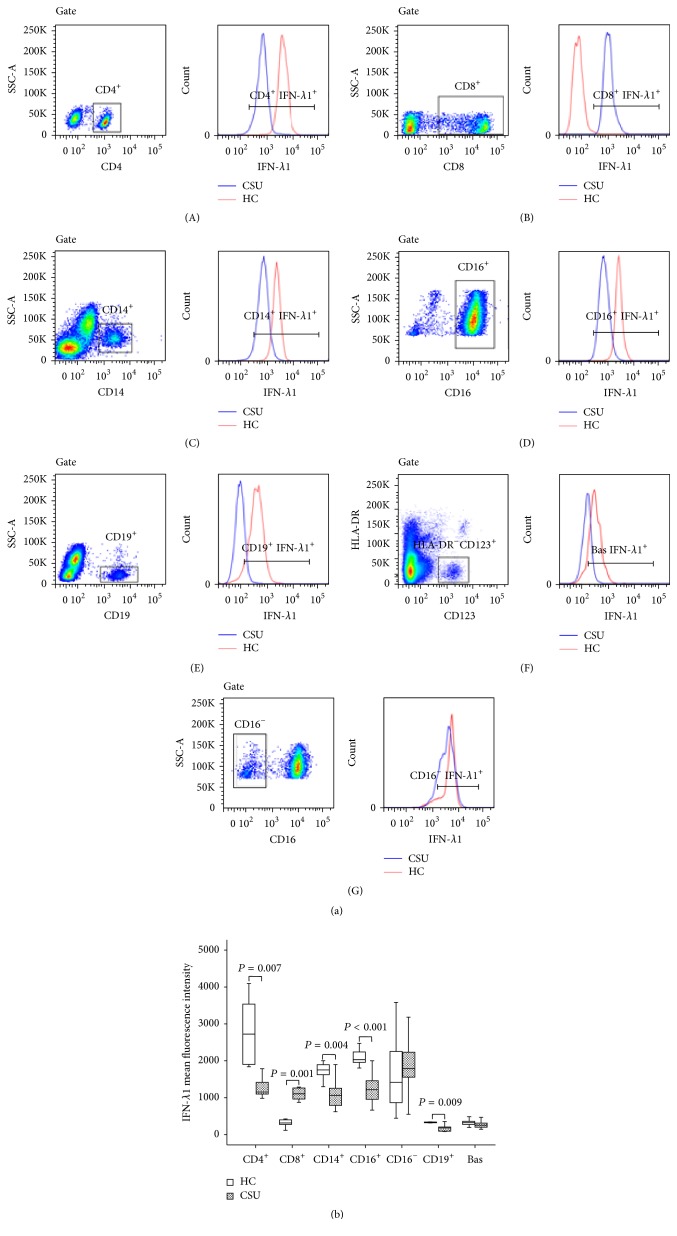
Figure 2.
Flow cytometry analysis of the expression of interferon- (IFN-) λ1 in peripheral blood leukocytes. (a) showed a representative graph of the changes in the mean fluorescence intensity (MFI) of IFN-λ1 in CD4+ (helper T cells), CD8+ (cytotoxic T cells), CD14+ (monocytes), CD16+ (neutrophils), CD19+ cells (B cells), CD123+HLA-DR− (basophils), and CD16− (eosinophils) in healthy control subjects (HC) and patients with urticaria, respectively. Gate represents gating strategy. (b) represents a boxplot of the expression of IFN-λ1 in peripheral blood leukocytes of the patients with urticaria and HC, which indicates the median (horizontal line), interquartile range, the largest, and smallest values other than outliers (whiskers) and the outliers (O). Each piece of data represented a group of minimum 7 subjects. P < 0.05 was taken as statistically significant.

