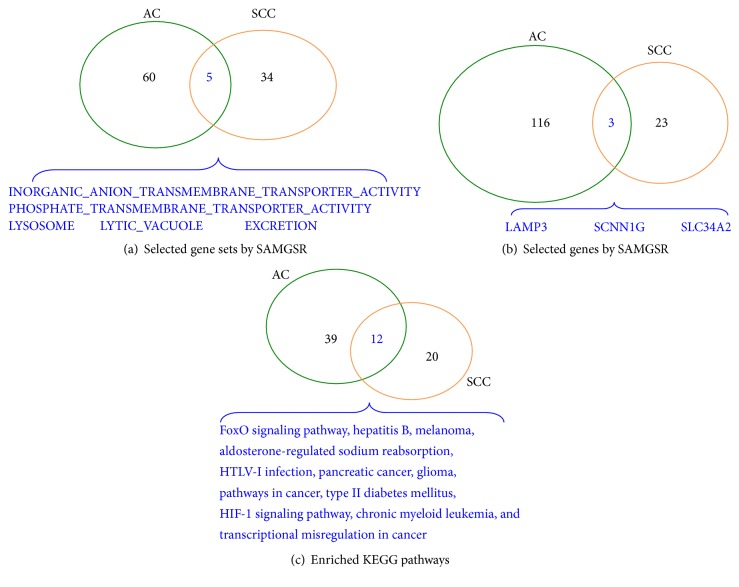
Figure 2.
Venn diagrams show how the selected gene sets and genes for SCC and AC stage segmentations overlap. (a) On the level of gene sets selected by SAMGS. (b) On the level of genes selected by SAMGSR. (c) On the level of enriched KEGG pathways. There are 5 overlapped gene sets, 3 overlapped genes, and 12 overlapped KEGG pathways, respectively.

