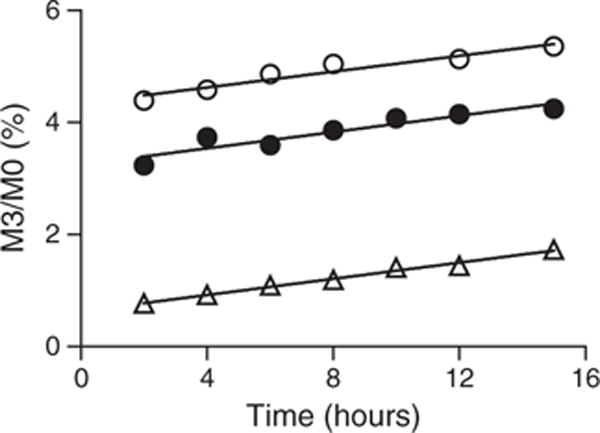
Figure 3.

Effect of Q1 resolution on the measurement of 2H3-leucine enrichment. Samples from a subject were digested and analyzed using microfluidic device with the Xevo TQS mass spectrometer. Open triangles: transition 788 → 1069.6, and Q1 was set at 0.4 FWHM; closed circles: transition 788 → 1069.6, and Q1 was 0.7 FWHM; open circles: transition 788 → 1072.6, and Q1 was 0.7 FWHM. The data were analyzed using linear regression fit. The slopes were 0.07199 ± 0.003533 (open triangles), 0.07267 ± 0.01209 (closed circles), and 0.0706 ± 0.009510 (open circles), respectively. Analysis of covariance test yielded a p value of 0.9867, indicating that the three plots had similar slopes (i.e., rates of change in the product labeling).
