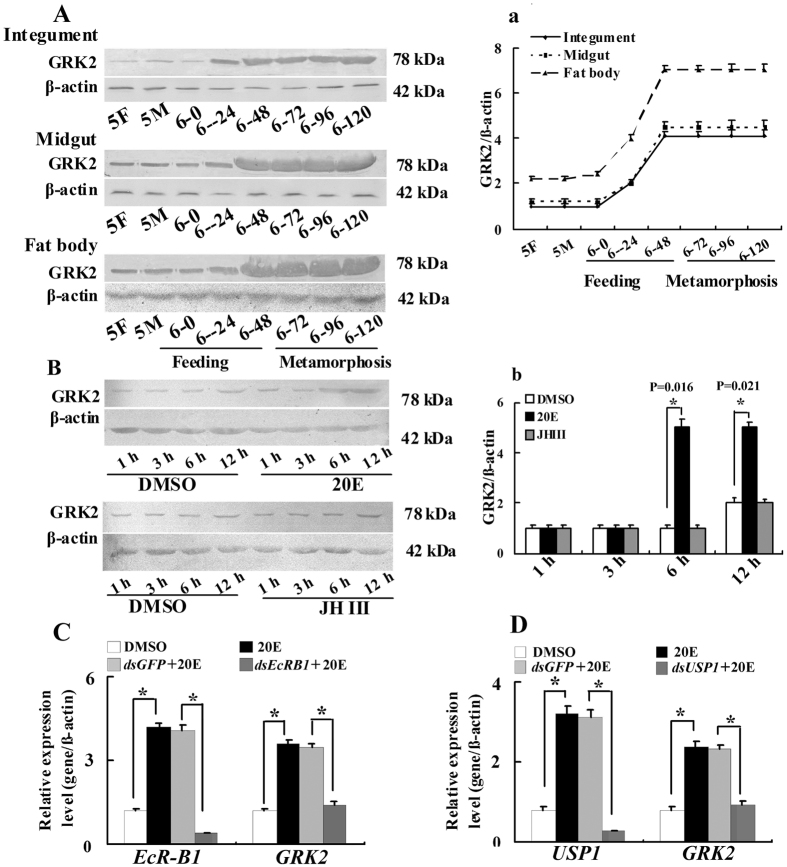
Figure 1. Western blot analysis showing GRK2 expression profiles during larval development.
(A) The GRK2 expression levels in the integument, midgut and fat body detected using an antibody against H. armigera GRK2. β-actin was used as the control and was detected using an antibody against H. armigera β-actin. 5F: fifth instar feeding larvae 24 h after ecdysis; 5M: fifth instar molting larvae; 6-0, 6-24, 6-48, 6-72, 6-96, and 6-120 represent sixth instar larvae at the corresponding times. Figure S5A are the full-length blots data a. Quantitative analysis of (A) using ImageJ software. (B) The sixth instar 6 h larvae were injected with 20E or JH III (500 ng/larva) for 1, 3, 6 and 12 h, and the integument proteins were examined (30 larvae, three triplicates). The sixth instar 6 h larvae were injected with equivalent volume of DMSO for 1, 3, 6 and 12 h as the control group (30 larvae, three triplicates). β-actin was used as the control. Figure S5B are the full-length blots data b. Statistical analysis of (B) according to the quantification of the bands with ImageJ software. Asterisks indicate significant differences between the groups (p < 0.05) by the Student’s t-test based on three independent experiments. The bars indicate the means + SD of three independent experiments. (C,D) 20E via EcRB1 and USP1 regulates GRK2 expression by qRT-PCR analysis. The cells were treated with dsEcRB1 or dsUSP1 (1 μg/ml for 12 h) and/or 20E (1 μM for 6 h). *P < 0.05 (Student’s t-test), based on three independent experiments. Error bars indicate the means + SD of three independent biological experiments

