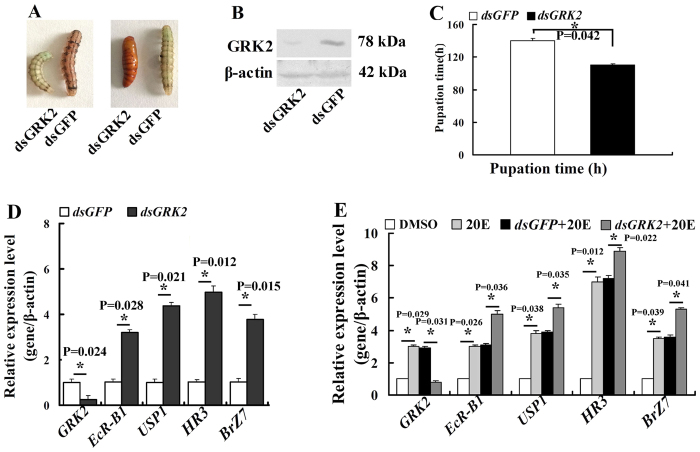
Figure 2. GRK2 suppressed 20E-induced metamorphosis and gene expression.
(A) Phenotypes 60 h after GRK2 knockdown (injection of dsGRK2 into sixth instar 6 h larvae, 500 ng/larva, twice in a 48-h interval) with dsGFP as the control. (B) Western blot analysis showing the efficacy of GRK2 knockdown in integument after 60 h from tissue homogenate of three larvae. β-actin was used as the control. Figure S6 are the full-length blots data. (C) Statistical analysis of the pupation time of 50% larvae (P50) after GRK2 knockdown (30 larvae, three triplicates) by the Student’s t-test. Asterisks indicate significant differences between the groups (p < 0.05) by the Student’s t-test. (D) Gene expression in the integument after GRK2 knockdown in larvae (500 ng of dsGRK2/larva, extracted RNA 48 h after first injection). Asterisks indicate significant differences between the groups (p < 0.05) by the Student’s t-test based on three independent experiments. (E) qRT-PCR analyses showing gene expression in HaEpi cells after GRK2 knockdown (1 μg/mL of dsGRK2, 1 μM 20E for 12 h). Asterisks indicate significant differences between the groups (p < 0.05) by the Student’s t-test based on three independent experiments. The bars indicate the means + SD of three independent experiments.

