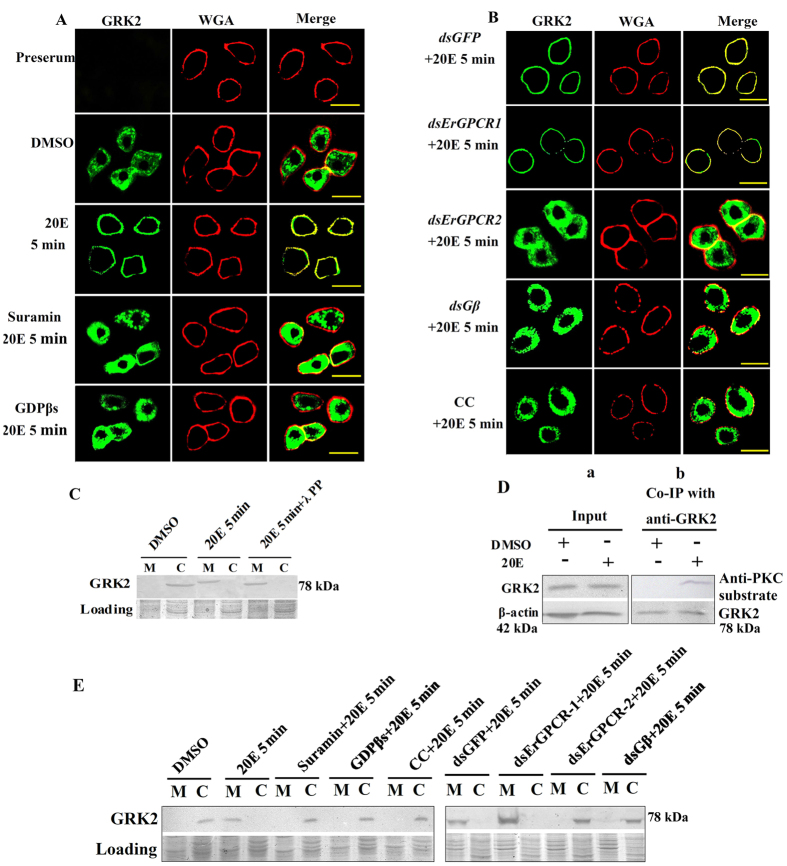
Figure 4. GRK2 relocates toward the cell membrane after 20E induction.
(A,B) Immunocytochemical analysis of GRK2 (green color) after different treatments using a Zeiss LSM 700 laser confocal microscope: 20E (1 μM for 5 min), suramin (50 μM for 60 min) + 20E (1 μM for 5 min), GDPβs (100 μg/mL) + 20E (1 μM for 5 min), dsErGPCR-1 (1 μg/mL), + 20E (1 μM for 5 min), dsErGPCR-2 (1 μg/mL) + 20E (1 μM for 5 min), CC (5 μM for 60 min) + 20E (1 μM for 5 min) by an antibody against H. armigera GRK2. The control received an equivalent volume of DMSO. Then 1 μg/mL Alexa Fluor 594-conjugated wheat germ agglutinin (WGA) was incubated with the cells in DPBS for 15 min at room temperature to label the plasma membrane (red color). Merge is the overlapped green and red. The yellow bar denotes 20 μm. (C) Western blots to confirm the phosphorylation of GRK2 after 20E treatment using anti-H. armigera GRK2. SDS-PAGE gel with Coomassie Brilliant Blue staining was performed at the same time as protein loading control to normalize the protein amounts in the membrane (M) and cytoplasm (C). λ PP: λ-protein-phosphatase (5 mM, 30 min at 30 °C). Figure S7 are the full-length blots and gels data. The gels ran under the same experimental conditions. (D) Analysis of the PKC phosphorylation of GRK2 (20E 1 μM for 5 min). Input: protein expression levels of GRK2 and β-actin in various treated cells using antibodies against H. armigera GRK2 and β-actin. β-actin was used as the loading control. Co-IP with anti-GRK2 and then detection with anti- phospho-PKC substrate antibody. The PKC substrate antibody was a polyclonal antibody against the phospho-(Ser) PKC substrate antibody which from Cell Signaling Technology Inc, USA. Figure S8 are the full-length blots data. (E) Western blotting to confirm the subcellular distribution of GRK2 after different treatments that were the same as in (A,B) using an antibody against H. armigera GRK2. SDS-PAGE gel with Coomassie Brilliant Blue staining was performed at the same time as loading of the control to normalize the protein amounts in the membrane (M) and cytoplasm (C). Figure S9 are the full-length blots and gels data. The gels ran under the same experimental conditions.

