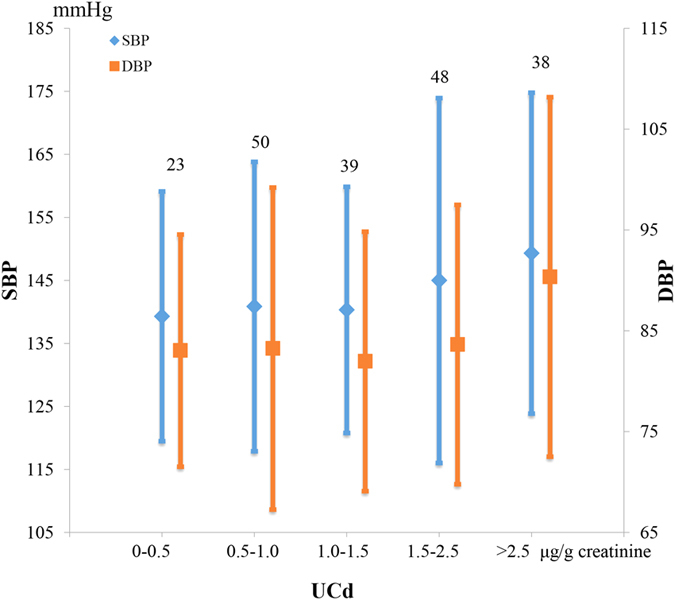
Figure 2. Mean SBP and DBP by UCd level.

The suspending figures represent subject numbers of each group. The error bars represent the standard deviations.

The suspending figures represent subject numbers of each group. The error bars represent the standard deviations.