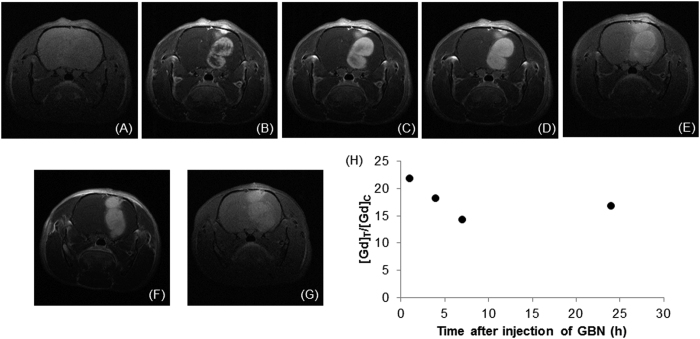
Figure 1. T1-weighted images of the brain of two 9LGS-bearing rats.
The images were acquired (a) before and (b) 1 min, (c) 10 min, (d) 15 min and (e) 1 h after intravenous injection of GBNs for rat 1, (f) 15 min and (g) 24 h after intravenous injection of GBNs for rat 2 (56 μmol Gd). (h) Temporal evolution of gadolinium concentration ratio between tumor and contralateral region (T/C ratio).

