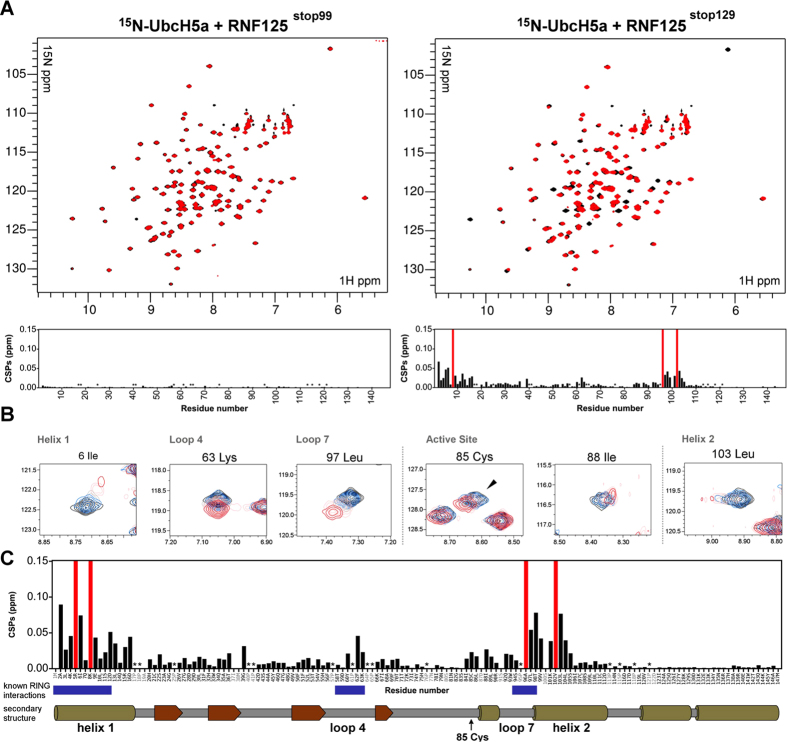
Figure 4. CSPs in 15N-UbcH5a caused by either RNF125stop99 or RNF125stop129.
(A) Overlay of 1H-15N HSQC spectra of 0.18 mM 15N-UbcH5a before (black), and after (red) addition of 0.5 molar equivalents of RNF125stop99 (left) or RNF125stop129 (right). Bar graphs represent the combined 1H and 15N chemical shift perturbations of 15N-UbcH5a at these molar ratios. The red bars indicate peaks that have broadened beyond detection. Pro residues are indicated by (*). (B) Expanded regions of 1H-15N HSQC spectra for 0.18 mM UbcH5a showing specific peaks before (black) and after the addition of RNF125stop129 at 0.125 (blue), 0.25 (grey), 0.5 (pink), 0.9 (red) molar equivalents. Peaks for residues at known RING binding sites are shown: I6 in helix 1, K63 in loop 4, L97 in loop 7; C85 is the active site Cys; I88 undergoes allosteric changes upon RING binding; L103 is present in helix 2.(C) Combined 1H and 15N chemical shift perturbations of 0.18 mM 15N-UbcH5a at 0.9 molar equivalents of RNF125stop129. Assigned residues are in black in the sequence underneath the graph, Pro are indicated by a (*). Red bars indicate residues that broadened beyond detection in the presence of RNF125stop129. The blue bars below the graph indicate areas that have been published to undergo extensive CSPs in similar NMR titrations: residues 1–12 in helix 1, 58–63 in loop 4 and 94–99 in loop 7. A schematic representation of secondary structure elements (α-helices as cylinders and β-sheets as arrows) of UbcH5a is also shown.

