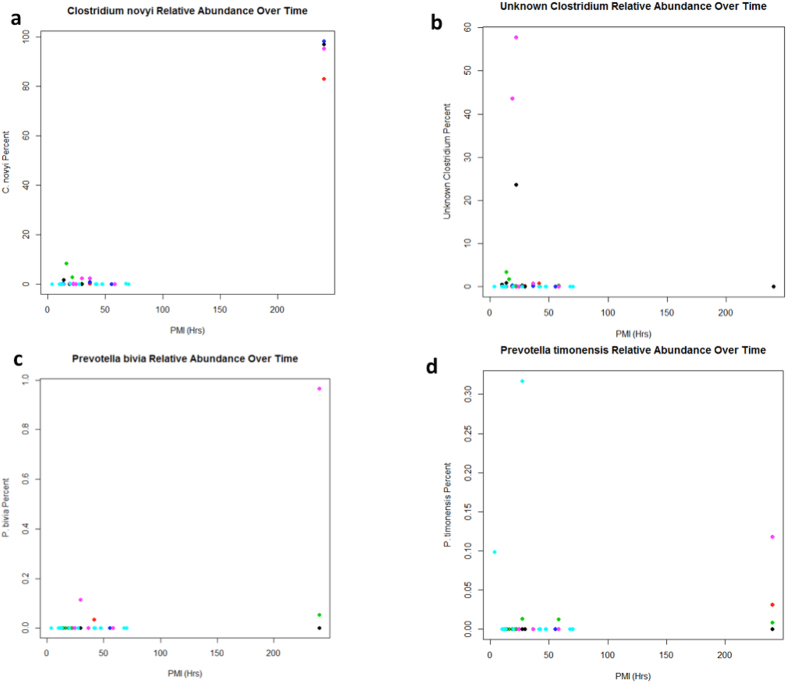
Figure 5. Taxa identified from a random forest analysis of the correlations between PMI and OUTs.
Each organ is represented by a different color: Red = Brain, Green = Heart, Blue = Liver, Black = Blood, Cyan = Mouth, Pink = Spleen. The X-axis is PMI in hours, and the Y-axis represents the percentage of sequence reads attributed to that species in the sample. Results are presented for (a) Clostridium novyi, (b) an unknown Clostridium, (c) Prevotella bivia, and (d) Prevotella timonensis.

