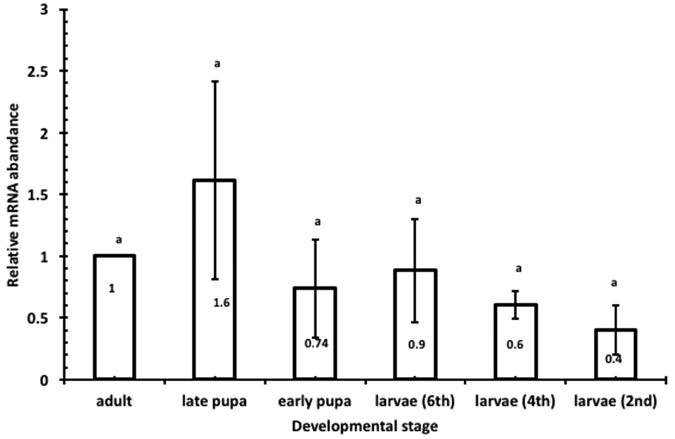
Figure 1. Stage-specific transcript levels in the whole body determined by qRT-PCR.

Mean ± SEM of three replications are shown. Means with the same letter are not significantly different (p = 0.05; ANOVA; with Tukey Kramer Multiple Comparison).

Mean ± SEM of three replications are shown. Means with the same letter are not significantly different (p = 0.05; ANOVA; with Tukey Kramer Multiple Comparison).