
Figure 6. Transcript levels of TcNav mRNA after normalization with the TcRPS6 as an endogenous control 72 h post larval oral feeding.
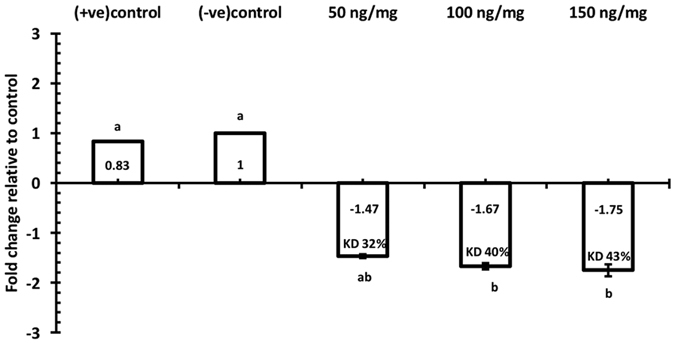
Mean ± SEM of three replications are shown. Means with the different letters are significantly different (p = 0.05; ANOVA; Tukey Kramer Multiple Comparison), +ve control = larvae fed on Kanamycin resistance dsRNA flour disks, −ve control= larvae fed on RNAase free water flour disks.