Figure 3.
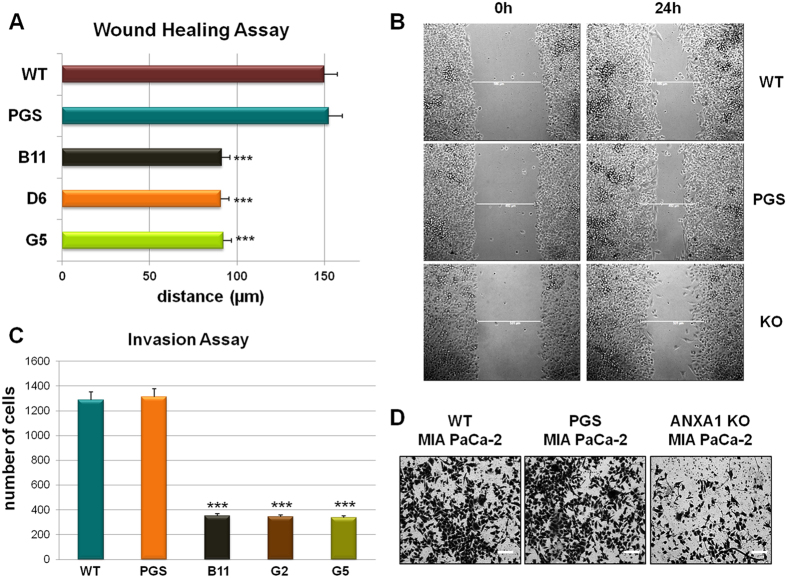
(A) Results of Wound healing assay on ANXA1 KO MIA PaCa-2; ***p < 0.01 vs WT and PGS MIA PaCa-2. The migration rate was determined by measuring the distances covered by individual cells from the initial time to the selected time-points (bar of distance tool, Leica ASF software). The data are representative of 5 independent experiments ± SEM. (B) Representative images captured by TIME LAPSE microscope of WT, PGS and ANXA1 KO MIA PaCa-2 at 0 h and 24 h from produced wounds. Magnification 10×. (C) Results of the invasion assay on ANXA1 KO, PGS and WT MIA PaCa-2 cells. Data represent mean cell counts of 12 separate fields per well ± SEM of 5 experiments. ***p < 0.001 vs WT and PGS MIA PaCa-2. (D) Representative images of analyzed fields of invasion assay. Magnification 20x. Bar = 150 μm

