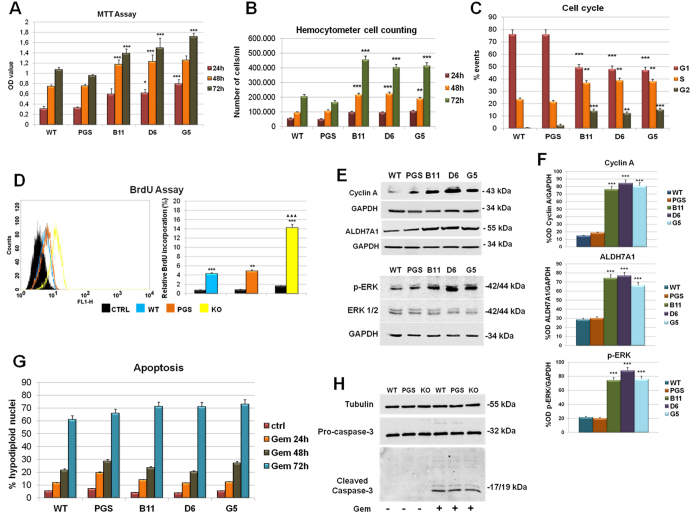
Figure 4.
(A) MTT assay at 24, 48 and 72 h on WT, PGS and ANXA1 KO MIA PaCa-2 (clones B11, D6 and G5). (B) Hemocytometer cell counts of WT, PGS and ANXA1 KO at 24, 48 and 72 h of cell culture. **p < 0.01; ***p < 0.001.(C) Cell cycle analysis with PI staining, the graph is representative of 72 h of culture, after 24 h of serum starvation. (D) Quantitation of BrdU-positive cells. Representative forward scatter histograms and statistical analyses of BrdU incorporation by WT, PGS and ANXA1 KO cells. ***p < 0.001 vs control; ▲▲▲p < 0.001 vs WT cells. (E) Western blot of Cyclin A, ALDH7A1, Phospho-ERK and ERK on WT, PGS and ANXA1 KO MIA PaCa-2 clones as B11, D6 and G5. All protein levels are normalized on GAPDH levels. Data are representative of 5 experiments with similar results. (F) Densitometry for cyclin A, ALDH7A1 and p-ERK expression in WT, PGS and ANXA1 KO MIA PaCa-2. Protein bands were normalized on GAPDH levels. The blots were exposed to Las4000 (GE Healthcare Life Sciences) and the relative intensities of bands were determined using ImageQuant software (GE Healthcare Life Sciences). ***p < 0.001. (G) Analysis of hypodiploid (apoptotic) nuclei by cytofluorimetric assay of the effect of gemcitabine 10 μM at 24, 48 and 72 h on WT, PGS and ANXA1 KO MIA PaCa-2 (three clones B11, D6, G5). The data are representative of 5 experiments with similar results. (H) Western blot for pro- and cleaved caspase-3. WT, PGS and ANXA1 KO MIA PaCa-2 clones were treated or not with gemcitabine 10 μM for 72 h. Protein bands were normalized on tubulin levels. Image is representative of three independent experiments performed on WT, PGS, B11, D6 and G5 ANXA1 KO clones.

