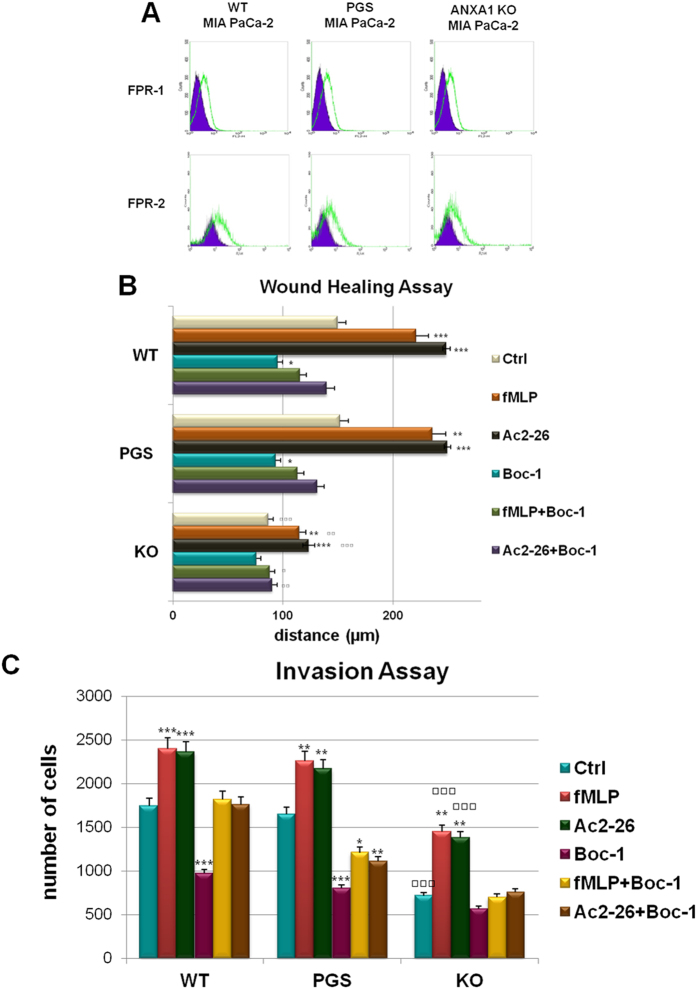
Figure 5.
(A) Cell surface expression of FPR-1 and FPR-2 in WT, PGS and ANXA1 KO MIA PaCa-2 cells was analyzed by flow cytometry. The violet areas in the plots are relative to secondary antibody alone. FPR-1 and FPR-2 signals are showed in green. (B) Wound Healing assay on ANXA1 KO, PGS and WT MIA PaCa-2 treated or not with fMLP (50 nM), Ac2-26 (1 μM), Boc-1 (10 μM) fMLP + Boc-1 and Ac2-26 + Boc-1. The migration rate has been calculated as reported in Methods section, *p < 0.05, **p < 0.01 and ***p < 0.001 vs untreated controls; ▫p < 0.05, ▫▫p < 0.01 and ▫▫▫p < 0.001 vs WT and PGS MIA PaCa-2 relative experimental points. Invasiveness rates were measured in (C) *p < 0.05, **p < 0.01 and ***p < 0.001 vs untreated control; ▫p < 0.05, ▫▫p < 0.01 and ▫▫▫p < 0.001 vs WT and PGS MIA PaCa-2 relative experimental points. Data represent mean cell counts of 12 separate fields per well ± SEM of 5 independent experiments. The data relative to ANXA1 KO are representative of three analyzed clones.

