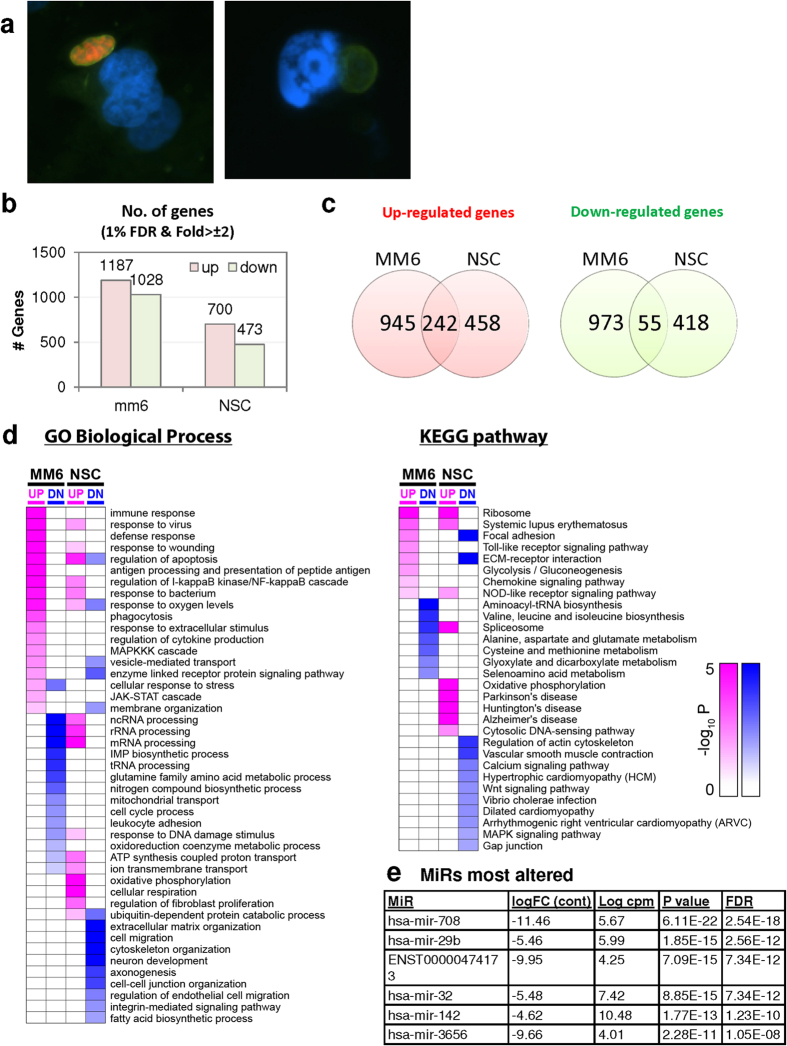
Figure 3. EGS morphology and effect on host cell transcriptomes.
(a) EGS in human MM6 cells and NSC form cysts. Left NSC with EGS. Right MM6 with EGS. Note green dolichos cyst walls and BAG1(red) in NSC. DAPI stained nuclei(blue). (b–d) Effects of EGS infection on MM6 and NSC transcriptomes: EGS transcripts in MM6 compared with NSC shows overlap of, as well as unique patterns of, transcripts. Differentially expressed genes in MM6 and NSC cells infected with EGS parasite were identified based on criteria of 1% FDR and absolute fold-change ≥2. Number of DEGs in each cell line are presented with bar graph (b) and Venn diagram are used to show general comparison of DEGs identified between the two cell lines (c). There is both commonality, overlap in genes modulated and independence in others between cell types indicating cell type also influences transcriptome. Red and green colors were used to represent up- and down-regulated genes, cell line used is indicated on bottom (b–d). Functional enrichment analysis was performed for gene ontology (GO) biological process and KEGG pathways (d). P-values derived from analysis were -log10 transformed and presented as a heat map. Pink and blue colors indicate GO terms or KEGG pathways enriched by up- and down-regulated genes, respectively. Enriched pathways or biological processes are listed on right of panels and cell lines are indicated on top. e. Host cell miR-seq analysis reveals that EGS regulates host cell miRNAs critical in pathogenesis and latency. Data are in Supplement B: Table S8. An especially interesting down-modulated miRNA is hsa-miR-708-5p which is expressed particularly in brain and retina cells causing apoptosis65. When T. gondii downmodulates this as an encysted bradyzoite in neuronal cells, it would prevent hosts from initiating apoptosis to eliminate chronically infected neurons. (f). Parasite genetics and human host cell type have a profound influence on T. gondii gene expression. MDS plot comparing T. gondii gene expression profiles from MM6 and NSC cells infected with EGS, GT1, ME49 and VEG strains for 18 hours and HFF cell cultures infected with EGS strain for 2, 18 and 48 hours.

