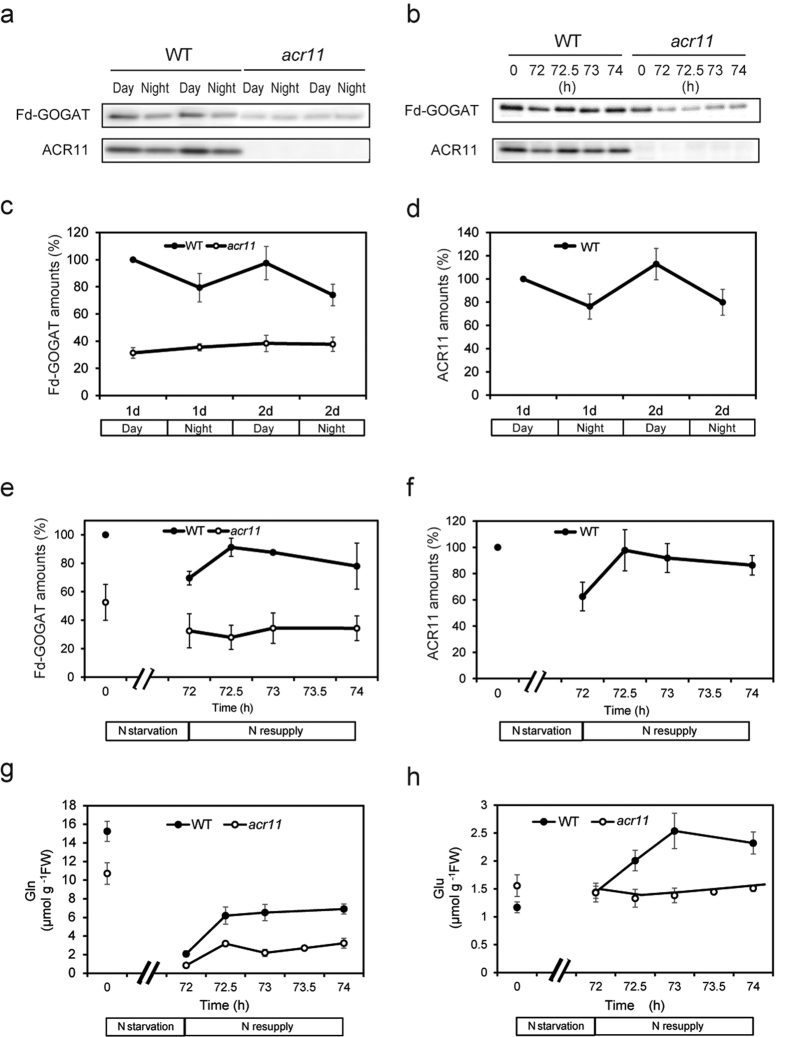
Figure 4. Profile of Fd-GOGAT and ACR11 levels under a diurnal cycle and in response to N starvation and subsequent N resupply treatments.
(a) Soluble proteins were extracted from rosette leaves of wild-type (WT) and acr11-1 mutant (acr11) plants grown for 4 weeks during the day and at night. Extracted proteins (corresponding to 5 mg fresh weight) were separated by SDS-PAGE using 6% (for Fd-GOGAT) or 14% (for ACR11) separation gels, followed by immunoblot analysis using anti-Fd-GOGAT and anti-ACR11 antibodies. (b) WT and acr11 plants were grown for 3 weeks in half-strength MS medium. Soluble proteins were extracted from rosette leaves harvested before (0 h) and after (72 h) 3-day N starvation treatments and subsequent N resupply treatments (72.5, 73, and 74 h). Extracted proteins (corresponding to 5 mg fresh weight) were separated by SDS-PAGE using 6% (for Fd-GOGAT) or 14% (for ACR11) separation gels, followed by immunoblot analysis using anti-Fd-GOGAT and anti-ACR11 antibodies. (c–f) Quantification of immunoblot signals was performed from three independent experiments using ImageJ software. Signal intensities were normalized relative to the intensities of the first daytime measurement (c,d) or before starvation (e,f) in the wild type. Means and standard deviations from three independent replicates are shown. Immunoblot analyses of Fd-GOGAT (c) and ACR11 (d) during the day and at night. Immunoblot analyses of Fd-GOGAT (d) and ACR11 (f) in response to N starvation and resupply treatments. (g,h) Measurements of glutamine (g) and glutamate (h) during N starvation and resupply. Means and standard deviations from three independent replicates are shown.

