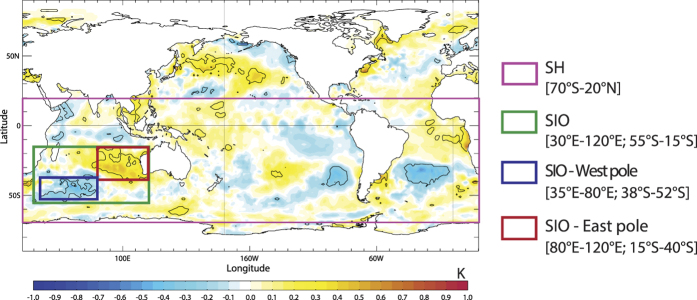
Figure 2. Composite SST anomalies for the first day of Perth HWs observed over 1979–2014.
(The 25 HW events are listed across the x-axis in Fig. 1.) Composite anomalies that are significant at the 90% confidence level using a Monte-Carlo procedure34 are shown in black contours. Boxes indicate key areas where SST indices (mean SST anomalies) are computed: over the Southern Hemisphere (SH, pink box), South Indian Ocean (SIO, green box) and SIO West (blue box) and East pole (red box) domains. This figure was produced with IDL version 8.1 software (2011, Exelis Visual Information Solutions, Boulder, Colorado, https://www.exelisvis.com/docs/whatsnew_in_8_1.html).

